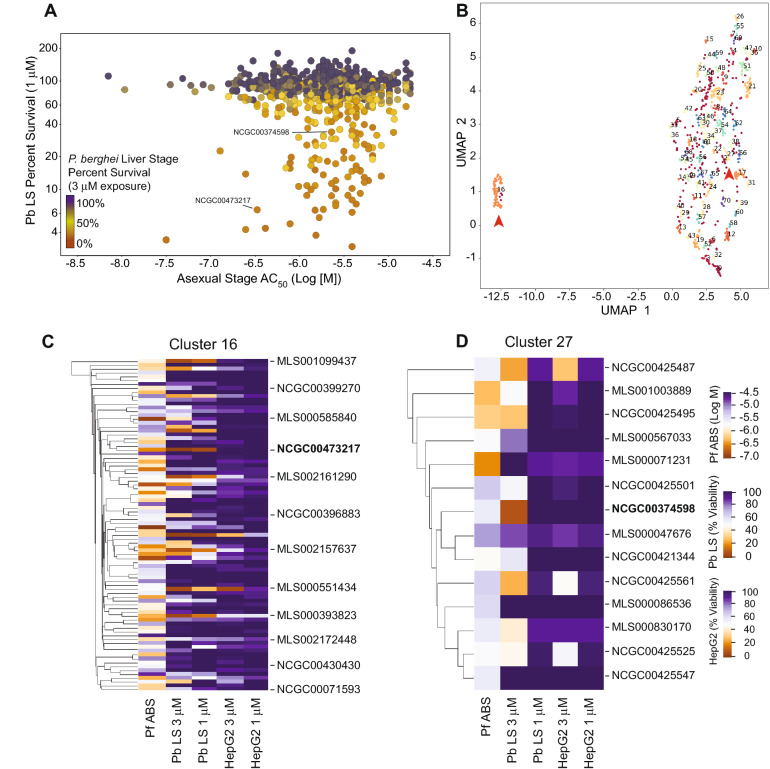
Figure 2.
Stage-specific activity and chemical relatedness of compounds active against P. falciparum ABS and P. berghei liver stage parasites. (A) Multidimensional scatterplot of P. berghei liver stage activity compared to P. falciparum asexual stage inhibition. P. berghei liver stage percent survival (Y-axis) was assessed at a single 1 μM concentration. The color denotes the survival in the liver stage assay at a single 3 μM concentration (red, 0% survival; black 100% survival). P. falciparum asexual activity AC50 value (X-axis) was determined from qHTS 72 h in vitro growth proliferation assays. (B) Uniform manifold approximation and projection (UMAP) of structural similarity, based on the Tanimoto coefficient, for the 994 compounds active against P. falciparum ABS parasites and screened for activity against P. berghei liver stages. Clusters 16 and 27 are highlighted with red arrowheads. (C,D) Depiction of clusters 16 (including the thiadiazine hit NCGC00473217) and 27 (including the pyrimidine azepine hit NCGC00374598). The compounds are clustered by Tanimoto similarity, with heat map representation of the ABS activity against P. falciparum Dd2-B2 (shown as Log [M] concentration values), activity against P. berghei liver stages (Pb LS), and toxicity against HepG2 cells, tested at both 3 μM and 1 μM and represented as percentage viability. Heat maps were generated on the UMAP data projection using the software DBSCAN (version 0.24.0; https://scikit-learn.org/stable/modules/generated/sklearn.cluster.DBSCAN.html; see “Methods” section).

