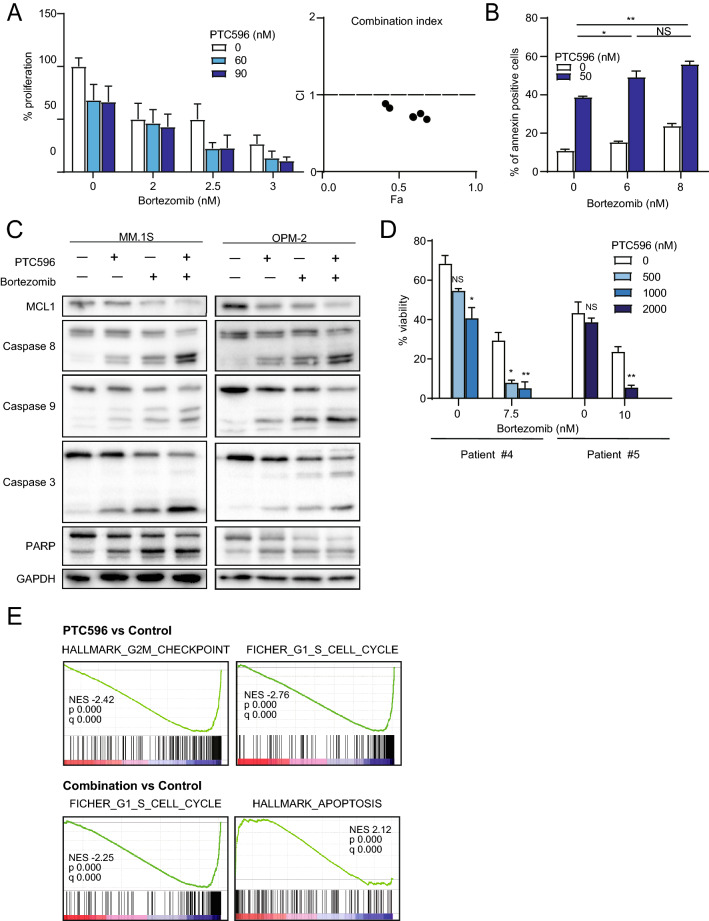
Figure 3.
PTC596 enhances bortezomib-induced apoptosis. (A) BrdU proliferation assay of MM.1S co-cultured with BMSCs derived from patients with MM upon treatment with the indicated doses of PTC596 and bortezomib for 48 h. Results of triplicate experiments and combination index values are shown in the left and right graphs, respectively. (B) Annexin V staining of OPM-2 treated with the indicated doses of PTC596 for 48 h and bortezomib for 24 h. Apoptotic cells were detected as Annexin V-positive cells by flow cytometry, and the results of duplicate experiments are shown. Data represent mean ± SD. *P < 0.05; **P < 0.01; ns, not significant using one-way ANOVA. (C) Western blotting analysis of the indicated proteins in MM.1S and OPM-2. MM.1S and OPM-2 were treated with PTC596 (100 nM) and/or bortezomib (2 nM for MM.1S and 5 nM for OPM-2) for 48 h. GAPDH served as a loading control. (D) The cytotoxicity of the combination treatment of PTC596 and bortezomib against primary MM cells. Viable cells were defined as those negative for Annexin V and PI by flow cytometric analyses. Primary MM cells were treated with the indicated doses of PTC596 and/or bortezomib for 12 or 24 h. Data represent mean ± SD. *P < 0.05; **P < 0.01; n.s., not significant using Student’s t-test or one-way ANOVA. (E) Gene set enrichment analysis plots showing the enrichment of cell cycle or apoptosis gene sets in MM.1S treated with PTC596 alone (left panels) and the combination (right panels) compared with non-treated control cells. MM.1S cells were treated with PTC596 (100 nM) alone or in combination with bortezomib (2 nM) for 24 h. Total RNA was extracted and RNA-seq was performed. Normalized enrichment scores (NES), nominal p values (NOM), and false discovery rates (FDR) are indicated.

