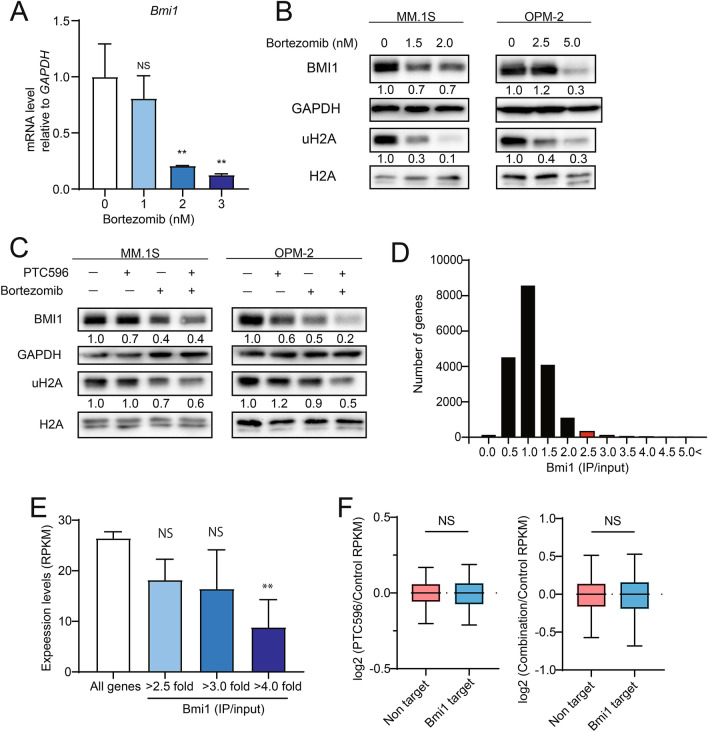
Figure 5.
PTC596 does not directly target BMI1. (A) Quantitative RT-PCR analysis of BMI1 in MM.1S treated with the indicated dose of bortezomib for 24 h. GAPDH was used to normalize the amount of input RNA. Data are shown as the mean ± SD (n = 3). **P < 0.01; n.s., not significant using one-way ANOVA. (B) Western blotting analysis of BMI1 and uH2A in MM.1S and OPM-2 upon treatment with the indicated doses of bortezomib for 48 h. GAPDH and H2A served as loading controls. (C) Western blotting analysis of BMI1 and uH2A in MM.1S and OPM-2 upon treatment with PTC596 (100 nM) and bortezomib (2 nM for MM.1S and 5 nM for OPM-2) alone or in combination for 48 h. GAPDH and H2A served as loading controls. (D) Bmi1 targets defined by ChIP-seq data of Bmi1. Graph showing the number of genes in each range of fold enrichment values (IP/input) of Bmi1. Genes with 2.5-fold enrichment of Bmi1 signals over the input signals in the promoter regions (transcription start sites ± 2.0 kb) were defined as direct targets of BMI1 (red bars). (E) Expression levels of all RefSeq genes and BMI1 target genes detected by RNA-seq (RPKM). Bmi1 target genes with fold enrichment greater than 2.5, 3.0, and 4.0 are depicted separately. **P < 0.01; n.s., not significant using Welch’s t-test. (F) Box-and-whisker plots showing the expression changes of 351 BMI1 target genes in MM.1S cells treated with PTC596 alone (left panel) and PTC596 in combination with bortezomib (right panel) compared with control cells. Boxes represent 25 to 75 percentile ranges. Vertical lines represent 10 to 90 percentile ranges. Horizontal bars represent median. ns not significant using Student’s t-test.

