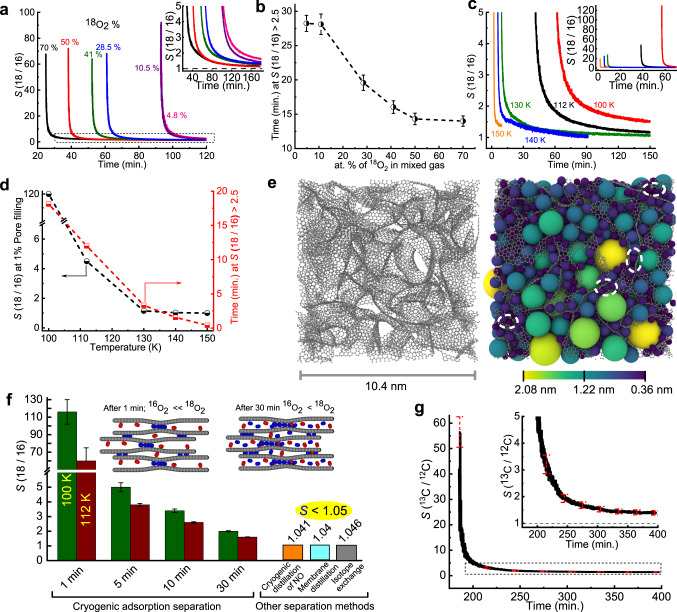
Fig. 2. Kinetic cryogenic adsorption-based selective separation of oxygen and methane isotopes using carbide-derived carbon (CDC).
a S(18O2/16O2) (referred to hereafter as S(18/16) in the figures) of the CDC at 112 K for different atomic % of 18O2 in the feed gas mixture (18O2 + 16O2) under similar dosing rate (~1 mL min−1). The percentage of 18O2 in the feed gas mixture varied from 4.8 at.% to 70 at.%. The inset shows an enlarged view of the dotted regions. The black dashed line represents S = 1. b Time of S > 2.5 for different percentages of 18O2 in the feed gas containing a mixture of the isotopes. Error bars (black lines) represent the standard deviations of three measurements. c Temperature dependence of selectivity S examined for equimolar (50 at.% 18O2) isotope mixtures using CDC at 100, 112, 130, 140, and 150 K. Inset shows a very high initial selectivity. d S at 1% pore volume filling (black) and time for which S > 2.5 (red) for CDC as a function of temperature. e, left: Simulated CDC structure. Gray spheres and lines represent the carbon atoms and their bonds, respectively. The snapshot shows a slice of the structure with a length of 10.4 nm and a depth of 3.5 nm. Right: 3D rendering of the same slice filled with nonoverlapping spheres. The spheres are colored by diameter, with the values indicated in the color bar. Dashed white ovals identify narrow pore sites filled with spheres of diameter <0.4 nm. f Comparison of S at different times at 100 K and 112 K for the CDC in this work with other separation methods from the literature. The inset shows illustrative models for the pore filling of CDC by 16O2 and 18O2 molecules after 1 min and 30 min. References correspond to cryogenic distillation (16,17), membrane distillation (18,19), and isotope exchange (20). g S(13CH4/12CH4) (written as S(13C/12C) in the figure) of CDC at 112 K for feed gas mixture (13CH4 + 12CH4) under similar dosing rate (~1 mL min−1). The inset shows an enlarged view of the dotted regions. The error bar represented by the red dashed line is the standard deviations derived from three measurements.

