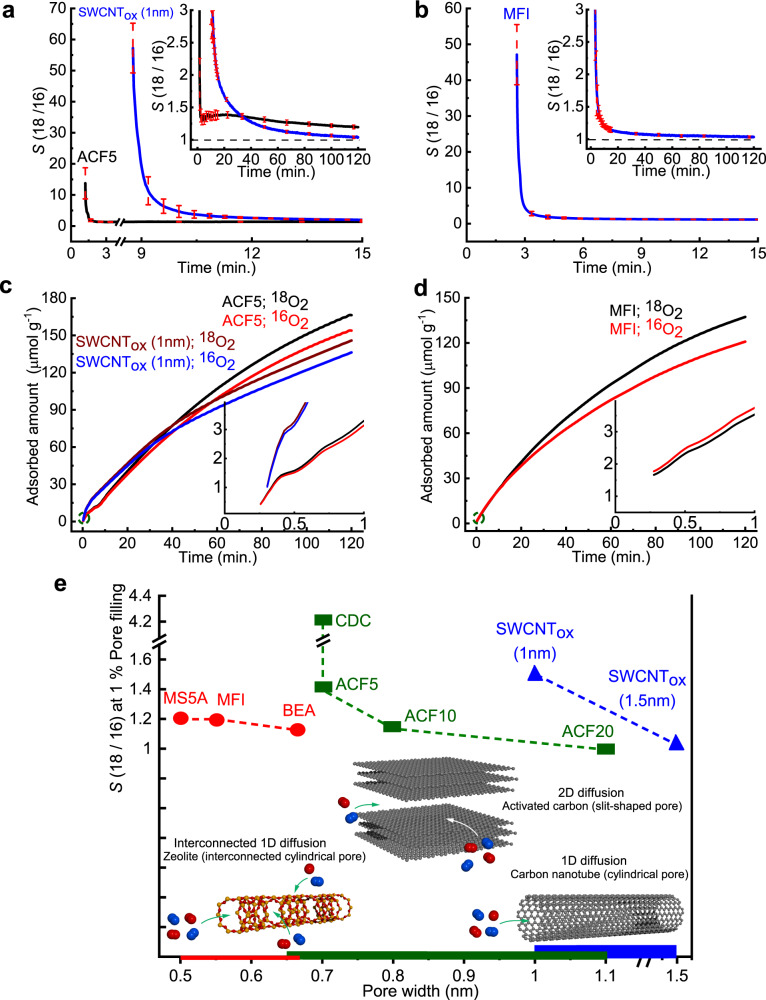
Fig. 3. Pore geometry effect on oxygen isotope adsorption separation.
a, b Time evolution of S for ACF5 and SWCNTox (1 nm) and zeolite MFI (solid lines), respectively, during the initial few minutes at 112 K. Red dashed lines represent standard deviations derived from four measurements. Insets show S for the full duration of the experiment. c, d Time evolution of the amount of adsorbed 18O2 and 16O2 on ACF5 and SWCNTox (1 nm) and zeolite MFI. The adsorption amount is calculated from the difference of feed mixed gas and the unadsorbed mixed gas. Insets show the enlarged view of the circled initial region. e Pore geometry-dependent selectivity S at 1% pore volume filling at 112 K. Slit pore (green rectangles) materials include carbide-derived carbon (CDC) and ACFs, cylindrical pore (blue triangles) materials are SWCNTox (1 nm) and SWCNTox (1.5 nm) and MS5A, MFI and BEA have channel cylindrical pores (red circle). An equimolar mixed gas (18O2 + 16O2) is used in all experiments performed at 112 K. The accessibility of oxygen molecules for each pore is schematically shown at the bottom.

