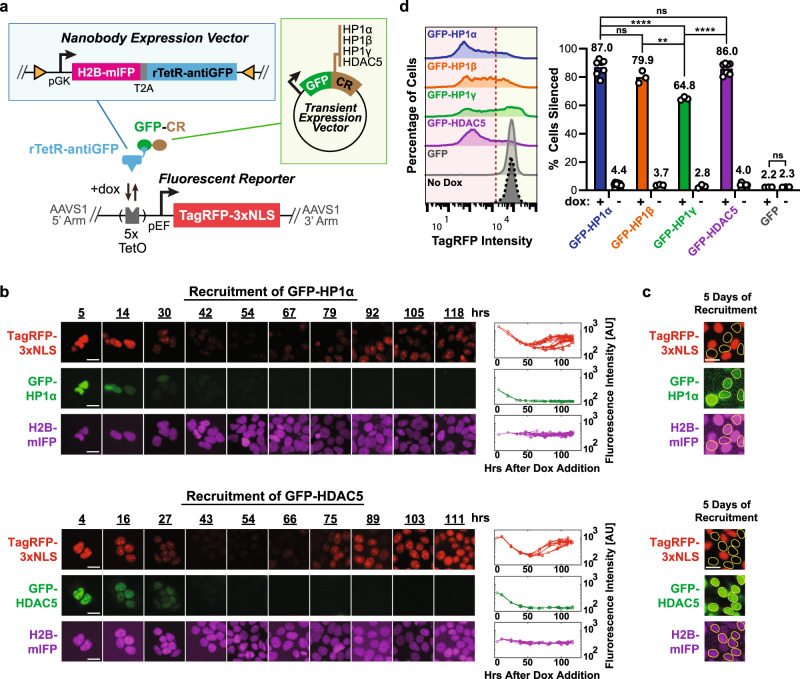
Fig. 1. Nanobodies against GFP-tagged chromatin regulators allow for gene expression control.
a Construct for constitutive coexpression (under the pGK promoter) of H2B-mIFP and antiGFP nanobody fused with the rTetR DNA-binding protein (separated by the self-cleaving peptide T2A) was randomly integrated into HEK293T cells by PiggyBac (blue box, top). These cells also contain a TagRFP reporter gene integrated at the AAVS1 “safe harbor” locus and driven by the pEF promoter (bottom). Five TetO-binding sites allow binding of rTetR upstream of the reporter gene upon dox addition. The nuclear localization signal (NLS) and H2B domains localize fluorescent protein signals to the nucleus, improving quantification during time-lapse imaging. Plasmids expressing GFP-tagged CRs (HP1α, HP1β, HP1γ, and HDAC5) were transiently transfected into cells (green box, right). b Time-lapse imaging of cells upon recruitment of GFP-tagged HP1α (top) and HDAC5 (bottom). Cells stably expressing the reporter (TagRFP, red) and the rTetR-antiGFP fusion (mIFP, purple) were transiently transfected with GFP-HP1α or GFP-HDAC5 (GFP, green). Cells were treated with dox throughout the movie starting at time 0 hours. Example images across the time-lapse movie (left) and single-cell traces for individual cell lineages as they undergo up to eight cell divisions (right). c Cells that still have GFP-CR expression (yellow circles) by day 5 of recruitment remain silenced. Images and analysis in b and c from one biological replicate. Scale bars: 20 μm. d Left: fluorescence distributions measured by flow cytometry showing reporter silencing after recruitment of GFP-CRs (+dox) for 5 days. Cells were gated for the presence of both GFP-CR (GFP positive) and rTetR-antiGFP (mIFP positive). The red dotted line was used to determine the percentage of cells silenced shown on the right. Right: mean percentage of cells silenced upon presence or absence of dox for 5 days. Each dot is an independently transfected biological replicate (GFP-HP1α: n = 7; GFP-HP1β: n = 3; GFP-HP1γ: n = 3; GFP-HDAC5: n = 7; GFP: n = 3). Statistical analysis by two-tailed Tukey’s test (GFP-HP1α vs. GFP-HP1γ: ****p = 4.8e − 6; GFP-HP1β vs. GFP-HP1γ: **p = 0.0031; GFP-HP1γ vs. GFP-HDAC5: ****p = 9.0e − 6). Source data are available in the Source Data file.

