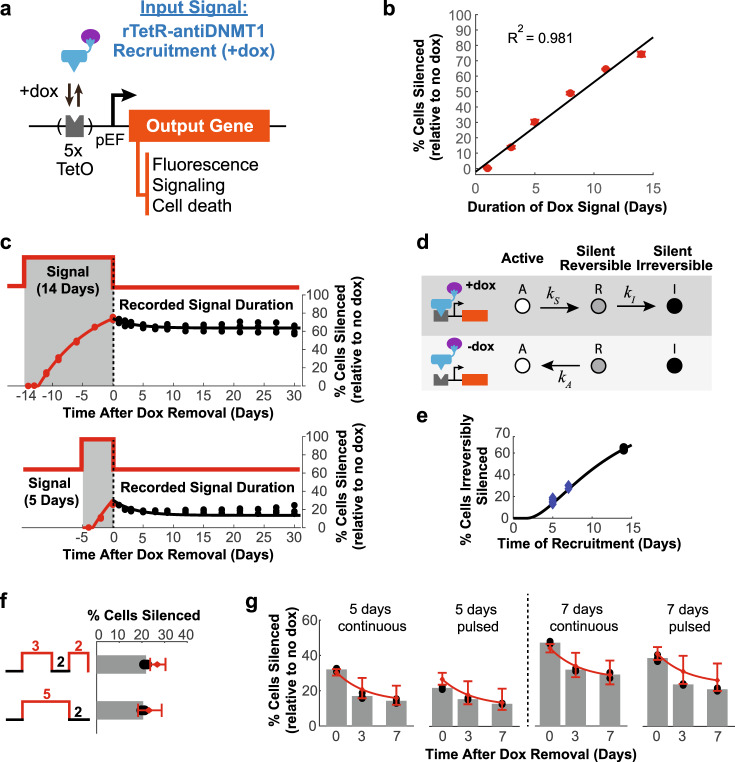
Fig. 4. Nanobodies as signal detection and recording tools.
a Schematic of a device for measuring and recording signal duration. The input signal is coupled to the recruitment of rTetR-antiDNMT1 near the pEF promoter to silence an output gene. b Percentages of cells with TagRFP reporter silenced as measured by flow cytometry at the end of the indicated dox signal durations in a cell line stably expressing rTetR-antiDNMT1. Means and SDs of experimental data from three replicates (red dots) and linear fit (black, “Methods”). c Percentage of cells with TagRFP silenced after different signal (dox treatment) durations: 14 days (top) and 5 days (bottom). The gray shaded regions (negative numbers) indicate the period with dox. Dashed lines indicate dox removal. Continuous lines represent fits to the model in d for the 14 days data and predictions of the model for the 5-day data (“Methods” and Supplementary Note). d Three-state model of silencing by antiDNMT1 during recruitment (+dox, top) and during release (−dox, bottom). e Percentage of cells irreversibly silent after different durations of recruitment (dox treatment) predicted by the model in d are plotted as a black line (“Methods”). Experimental data recorded at 7 days during the release period shown as black dots if used for model fitting (14 days), or blue diamonds if not used in the fit. f Percentages of cells silenced relative to no dox controls for pulsed recruitment (top: 3 days +dox, 2 days −dox, 2 days +dox) compared to continuous recruitment for the same duration (bottom: 5 days +dox, 2 days −dox). Experimental data from three replicates shown as black dots, means as gray bars, and model predictions with 95% CI in red (“Methods”). g Percentages of cells silenced relative to no dox controls for pulsed recruitment vs. continuous recruitment, recorded at the same time after dox removal, plotted as in f. Source data are available in the Source Data file.

