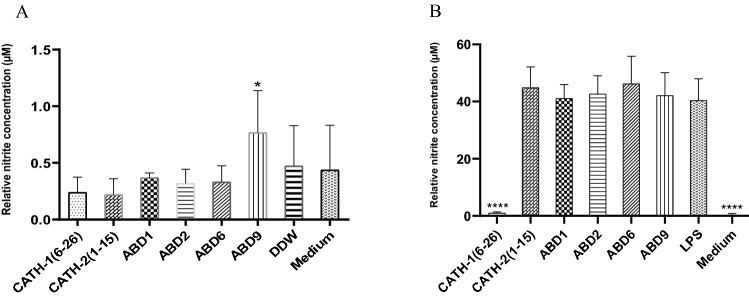
Figure 5.
NO production and neutralisation of LPS-induced NO production using the Griess assay. (A) NO production by HD11 cells stimulated with 20 µg/ml each peptide after 24 h incubation. * means significantly different between the ABD9 treated and untreated groups (medium group) with p < 0.05. (B) Neutralization of LPS-induced NO production of HD11 cells by 20 µg/ml of AMPs post 24 h stimulation. **** means significantly different from the LPS-treated group (p < 0.0001). One-way ANOVA analysis using the Dunnett post-hoc test was used. All data shown are obtained from at least three independent experiments on different days, means ± SD.

