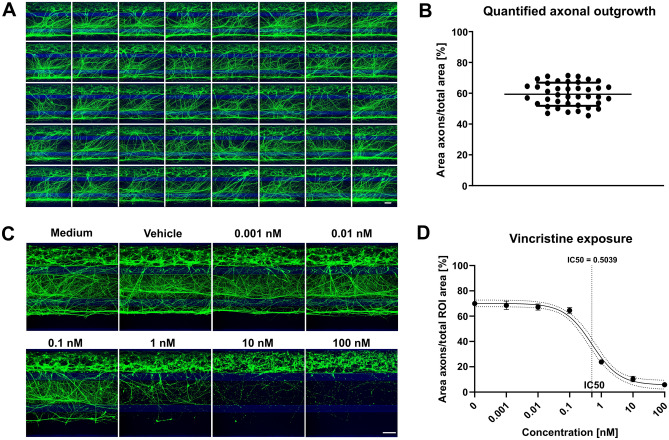
Figure 4.
Robust 3D axonal outgrowth model allows assessment of neurite disrupting compounds. (A) Montage of a complete OrganoPlate containing 40 chips, each showing 3D axonal outgrowth at day 17 of culture visualized by calcein-AM dye. Maximum projection images, the scale bar is 200 µm. (B) Quantification of axonal outgrowth shown in (A), n = 40. Graph shows mean ± SD. (C) Motor neurons (day 17) were exposed to various concentrations of vincristine for 4 days. Cultures were visualized with calcein-AM dye. Maximum projection images, the scale bar is 200 µm. (D) Quantification of axonal outgrowth depicted in (C). Dose–response curve showing the effect of vincristine exposure on axonal outgrowth. Graph shows mean values ± SEM and a 95% confidence interval (dotted lines) around the curve. n = 5. The graphic representations in (B) and (D) were created using GraphPad Prism, version 8.3.1 (https://www.graphpad.com/scientific-software/prism/).

