Figure 6.
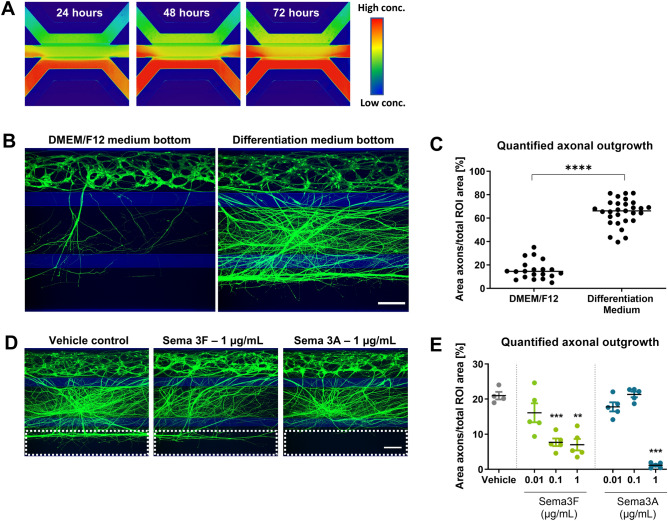
Attraction and repulsion of axons. (A) Gradient formation is visualized by perfusion of a fluorescein isocyanate (FITC)-Dextran (150 kDa) molecule through the bottom lane of a tissue culture chip. Images were taken at 24 h, 48 h, and 72 h after perfusion, showing stable gradient formation in the OrganoPlate. (B) Motor neurons (day 17) were cultured with either DMEM/F12 or motor neuron differentiation medium in the bottom lane to assess axon attraction. Cultures are visualized using calein-AM dye. Maximum projection images, the scale bar is 200 µm. (C) Quantification of axon outgrowth shown in (B) shows a significant (P < 0.0001) increase in outgrowth upon perfusion of the bottom lane with motor neuron differentiation medium. Graph shows mean ± SEM, n = 20–29, N = 2; unpaired t test. (D) Motor neurons (day 17) were cultured with either semaphorin 3F (SEMA3F) or 3A (SEMA3A) in the bottom lane to assess axon repulsion. Cultures are visualized using calein-AM dye. Maximum projection images, the scale bar is 200 µm. Dashed lines indicate the region of interest for axon outgrowth quantification in (E). (E) Quantification of the axon outgrowth depicted in (D). Axons were significantly less prevalent in the bottom microfluidic lane when perfused with SEMA3F (1 µg/mL, P = 0.001; 0.1 µg/mL, P = 0.0003) or SEMA3A (1 µg/mL, P = 0.001). Graph shows mean ± SEM, n = 5, *(P < 0.05), ** (P < 0.01), or *** (P < 0.001); Brown-Forsythe and Welch test. The graphic representations in (B) and (D) were created using GraphPad Prism, version 8.3.1 (https://www.graphpad.com/scientific-software/prism/).

