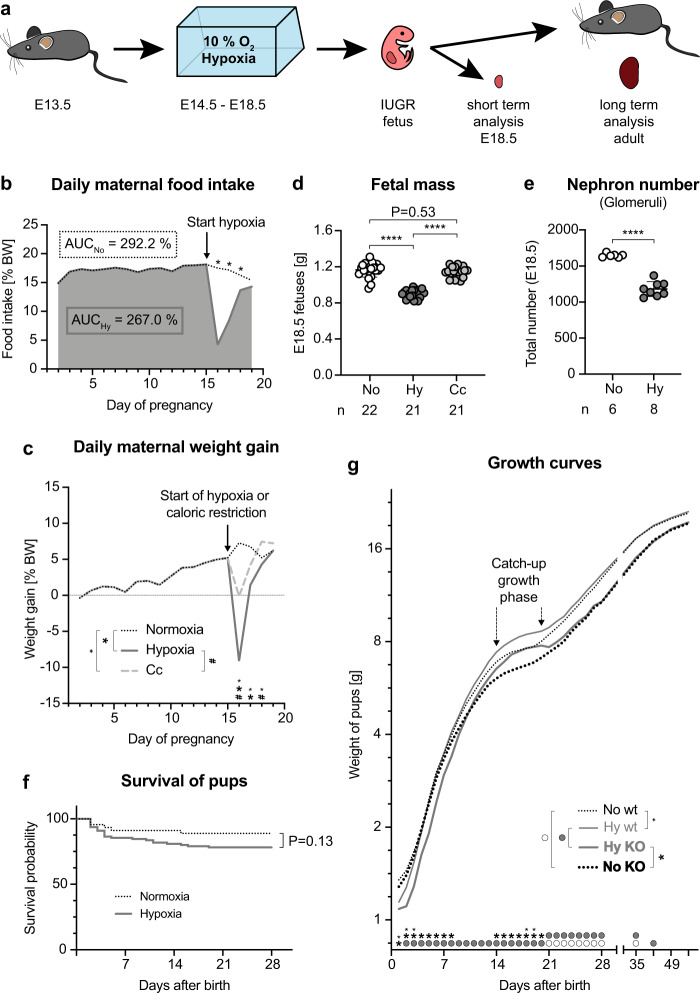
Fig. 1. Chronic fetal hypoxia induces intrauterine growth restriction in mice.
a Experimental setup and time points of analysis. b Mean relative daily food intake shown for all dams until start of hypoxia (arrow), thereafter normoxic dams (black dotted line) or hypoxic dams (bold dark gray line) are separated. During whole gestation, normoxic dams consumed 292.2% of their body weight, while hypoxic mice ate 267%. This corresponds to 91.4% of the food consumed by normoxic mice. Asterisks denote significance (day 16 and 17 P < 0.0001, day 18 P = 0.0398). c Mean relative daily maternal weight gain shown for all dams until the start of intervention (arrow), thereafter normoxic dams (black dotted line), hypoxic dams (bold dark gray line), or Cc dams (dashed light gray line) are separated. Significance is denoted by large asterisks (normoxia vs. hypoxia: day 16 and 17 P < 0.0001), small asterisks (normoxia vs. Cc: day 16 P = 0.0002, day 17 P = 0.0012, day 18 P = 0.0082) or # (hypoxia vs. Cc: day 16 P < 0.0001, day 18 P = 0.0007). d Fetal mass shown as mean ± SEM. N = fetuses. Ordinary one-way ANOVA with Tukey’s multiple comparison test. e Number of nephrons per E18.5 kidney determined by staining for the glomerular marker nephrin shown as mean ± SEM. N = fetal kidneys. Unpaired 2-sided t-test with Welch’s correction. f Survival of normoxic and hypoxic pups. Mantel-Cox log-rank test. g Mean postnatal weight of hypoxic offspring (Ahsg KO—bold gray line, wild-type-thin gray line) and normoxic offspring (Ahsg KO—bold black dotted line, wild-type—thin black dotted line). KOs weighed less than wild-types, catch-up growth was observed for hypoxic offspring during the third week after birth. Gray circles denote significance between hypoxic offspring, white circles between normoxic offspring, large asterisks between KOs, and small asterisks between wild-types. P-values are listed in Supplementary Table 8. Individual P-values are denoted above the comparison lines (d, e). N = dams (b, c) or pups (f, g) can be derived from Source Data. Multiple 2-sided t-tests (b, c, g). (****P < 0.0001). Source data are provided as a Source Data file.

