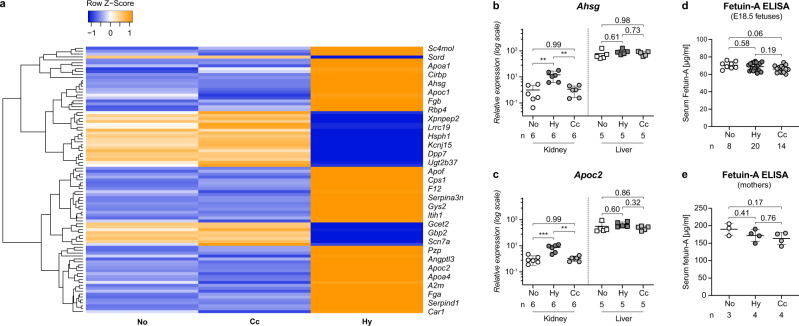
Fig. 2. Hypoxia-induced gene expression in the kidney.
a Hierarchical clustering of cDNA microarray data comparing the renal gene expression profiles of hypoxic (Hy), normoxic (No), and caloric control (Cc) group E18.5 fetuses (N = 3 per experimental condition). Orange indicates induction, blue repression. Clustering was performed for genes with at least 1.3-fold regulation of hypoxic vs. both normoxic controls; 1way ANOVA; P < 0.05. b, c Relative mRNA values of Ahsg (b) or Apoc2 (c) in E18.5 kidneys (circles) or liver samples (squares) shown as mean ± SEM. N = fetal organs. Kidney and liver samples are analyzed separately. Note the logarithmic scale on the y-axis. d, e Serum fetuin-A levels assessed by ELISA are presented as mean and ± SEM. N = serum samples. No significant changes were observed among normoxic (No), hypoxic (Hy), or caloric control (Cc) E18.5 fetuses (d), nor for their mothers (e). Ordinary one-way ANOVA with Tukey’s multiple comparison test (b–e). Individual P-values are denoted above the comparison lines (b–e). (***P < 0.001; **P < 0.01). Source data are provided as a Source Data file.

