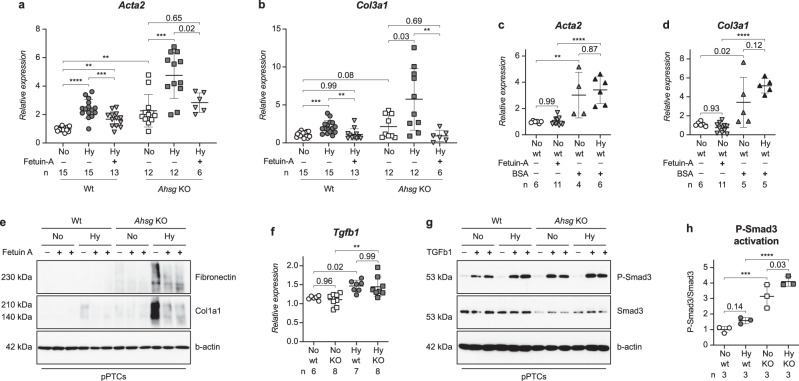
Fig. 6. Fetuin-A attenuates hypoxia-induced expression of fibrotic markers.
a, b Fetuin-A supplementation (downward pointing triangles) attenuated the hypoxia-induced expression of the fibrotic markers Acta2 (a) or Col3a1 (b) in pPTCs. Wt and Ahsg KO samples are analyzed separately. Unpaired two-tailed t-test with Welch’s correction (only for comparison of normoxic wt and normoxic Ahsg KO samples). c, d BSA supplementation (upward pointing triangles), did not reduce the expression of Acta2 (c) or Col3a1 (d) in pPTCs. e Fetuin-A supplementation also reduced the expression of fibronectin and collagen type I (Col1a1) protein in pPTCs. Images are representative of two Western blots. Uncropped blots in Source Data. f Relative mRNA expression levels of Tgfb1 shown as mean ± SEM were markedly enhanced in kidneys of hypoxic offspring, regardless of genotype. N = hypoxic or normoxic offspring. g TGF-β1 treatment and hypoxia had an additive effect on the phosphorylation of Smad3 in pPTCs. Images are representative of three Western blots. Uncropped blots in Source Data. h Quantification of Smad3 activation shown in g. N = three independent Western blots. Ordinary one-way ANOVA (Fisher’s LSD test). Data were analyzed from N = pPTCs derived from kidneys of wt or Ahsg KO mice and are presented as mean ± SEM (a–d). Ordinary one-way ANOVA with Tukey’s multiple comparisons test (a–d, f). Individual P-values are denoted above the comparison lines (a–d, f, h). (****P < 0.0001; ***P < 0.001; **P < 0.01). Source data are provided as a Source Data file.

