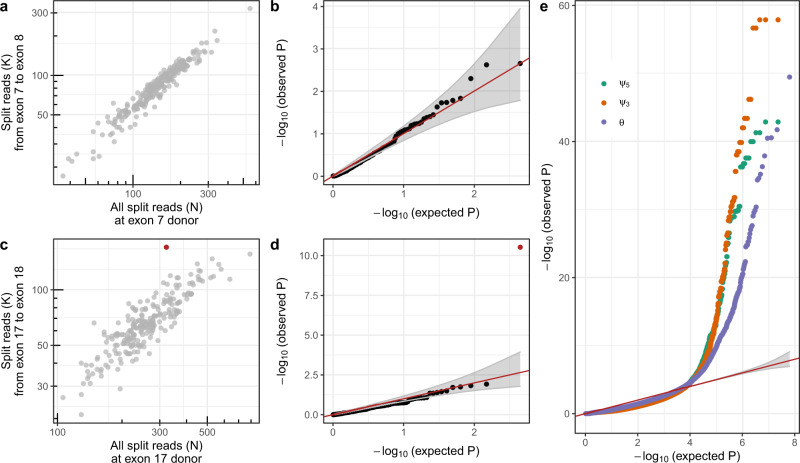
Fig. 3. Splicing outlier detection based on the beta-binomial distribution.
a Intron split read counts (y-axis) against the total donor split read coverage (x-axis) for the seventh intron of SRGAP2. b Observed negative log-transformed P values (y-axis) against expected ones (x-axis) of the ψ5 metric for the data shown in a. Under the null hypothesis, the data are expected to lie along the diagonal (red, 95% confidence bands in gray). c Same as a for the 17th intron of SRRT, showing an outlier (FDR < 0.1, red). d Same as b for the 17th intron of SRRT. The outlier is marked in red. e Same as b across all introns and splice sites for ψ5 (green), ψ3(orange), and splicing efficiency (θ, purple). a–e Based on the suprapubic skin tissue from GTEx (n = 222). b, d, e P values were calculated two-sided with the beta-binomial distribution and significance was determined based on FDR after adjusting for multiple comparisons (“Methods” section). FDR false discovery rate.

