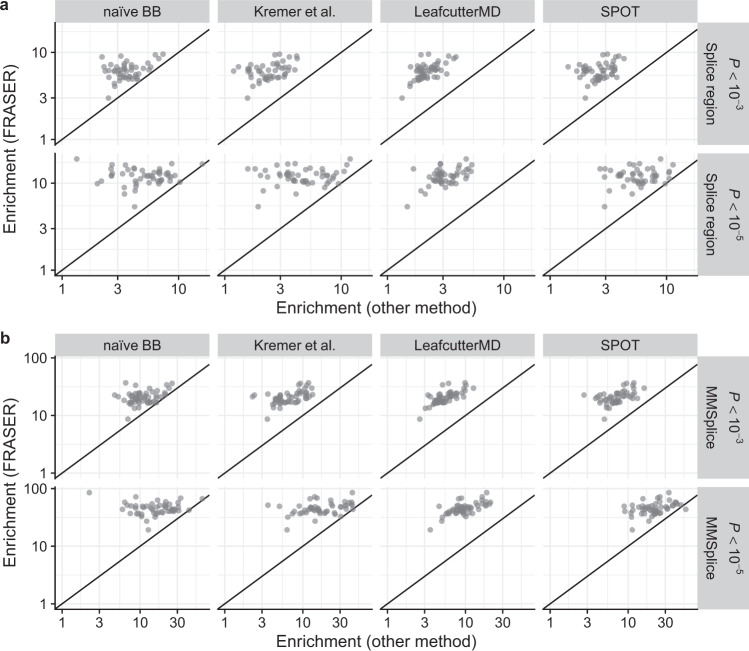
Fig. 5. Enrichment for rare variants predicted to affect splicing.
a Enrichment using FRASER (y-axis) against enrichment (x-axis) using different aberrant splicing detection methods (columns) for rare variants located in a splice region. The enrichment is calculated for different nominal P value cutoffs (rows). The applied methods are a naïve beta-binomial regression, the LeafCutter adaptation of Kremer et al.17, LeafCutterMD20, and SPOT21. Each dot represents a GTEx tissue (n = 48). b Same as a but the enrichment is computed for rare variants predicted to affect splicing by MMSplice10. BB beta-binomial.

