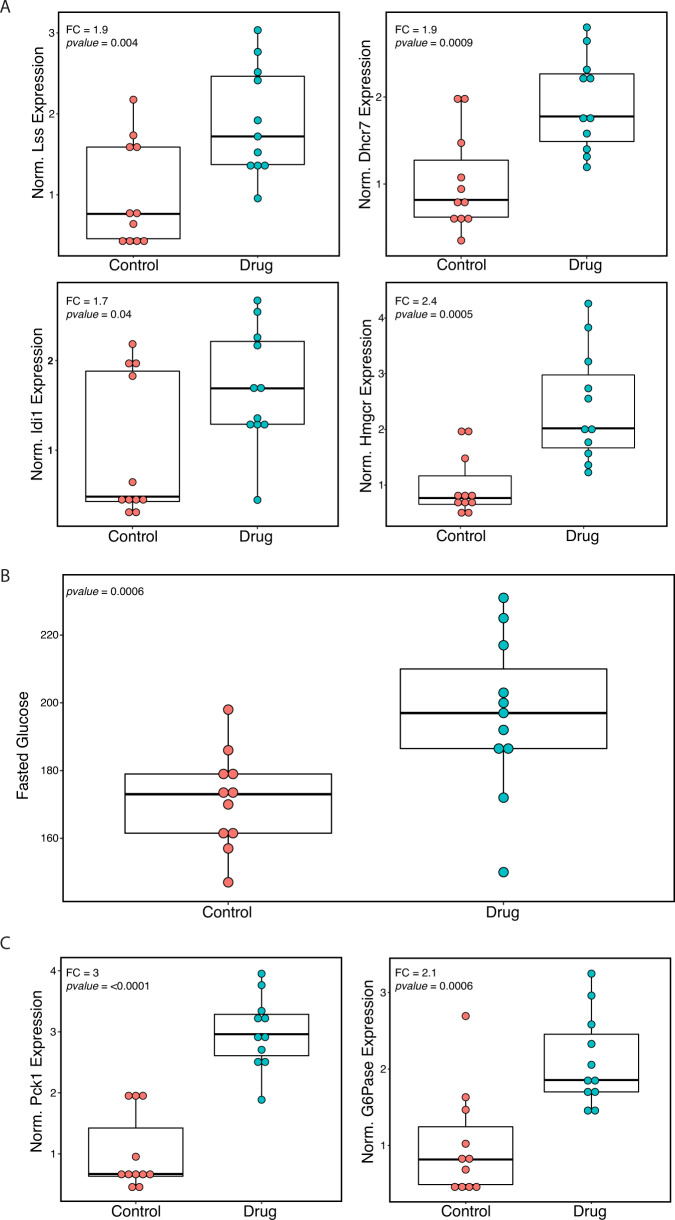
Fig. 5. Inhibition of Lss in mouse model.
A Boxplots of qPCR expression for Lss, Dhcr7, Idi1, and Hmgcr measured from liver samples of B6 mice fed either chow (control) diet or drug (BIBB515, Lss inhibitor) diet. B Boxplots of fasted glucose measured from blood at the end of 10 days of diet. C Boxplots of two key gluconeogenesis genes, PEP Carboxykinase (Pck1), and Glucose-6-Phosphatase (G6Pase), measured from qPCR of liver samples. n = 11 animals with control diet and 11 animals with drug diet. Center line, median; box limits, upper and lower quartiles; whiskers, 1.5x interquartile range; points, all individual data points.

