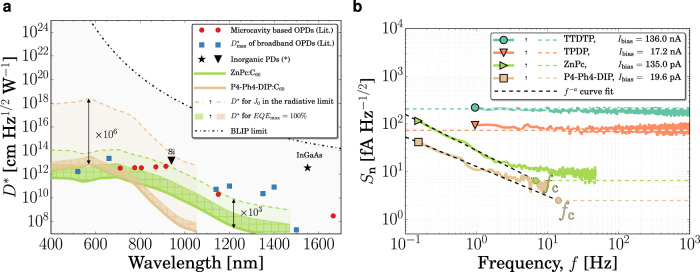
Fig. 1. Specific detectivity and spectral noise density.
a D*of two donor:C60 (6 mol%) material systems assuming shot noise at −1 V and EQE as measured (solid lines), shot noise at −1 V and normalized EQE at the maximum of the spectrum (hatched region), and shot noise in the radiative limit and EQE as measured (dashed lines). Symbols show data from literature8,15–22. b Sn of four donor:C60 (6 mol%) material systems. Dashed lines represent the shot noise calculated at Ibias. See Supplementary Figs. 15 and 16 for more results. (*) Hamamatsu K1713-05.

