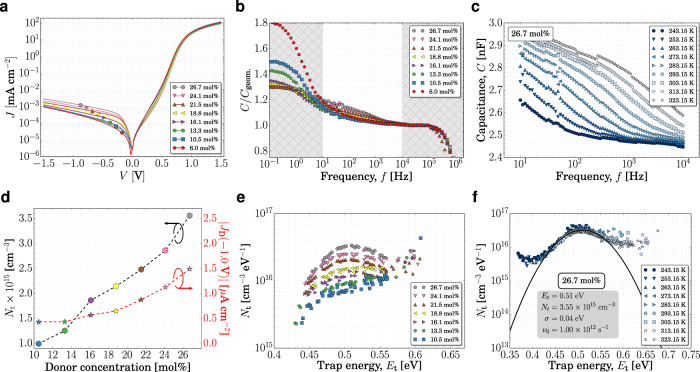
Fig. 3. Increasing the trap density in TPDP:C60 devices.
a Dark JV curves, b normalized capacitance, and e Nt at 293.15 K of TPDP:C60 blends with different D–A mixing ratios. Due to the small capacitive contribution of the traps at very low concentrations, the method fails in reconstructing the trap density of states. Therefore, the results of the 6.0 mol% device are not shown. c Capacitance and f Nt for 26.7 mol% at different temperatures reconstructed as proposed previously44. d Trap density (left black y-axis) and |JD(−1.0 V | (right red y-axis) versus donor concentration. Trap energies represents the energy difference from C60 LUMO (LUMOC60 - Et)62. The hatched areas in (b) show the frequency ranges excluded from the trap analyses as discussed in the text. Cgeom. refers here to the capacitance at 100 kHz, where the geometric capacitance dominates.

