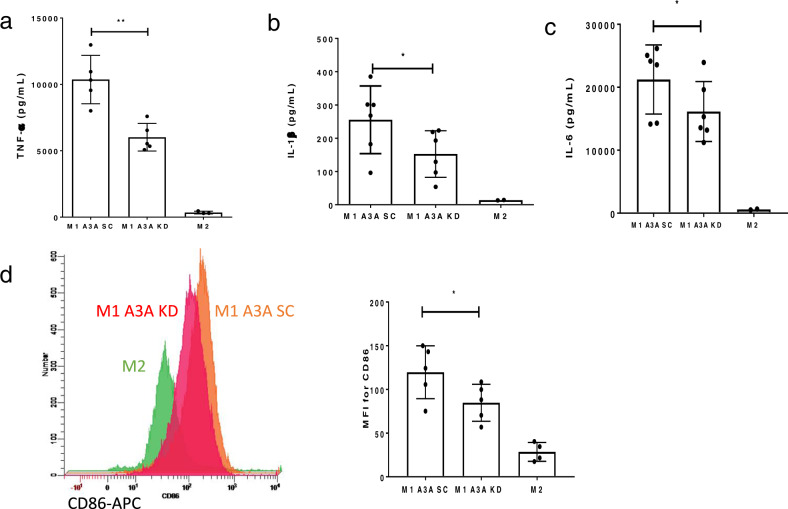
Fig. 6. Knockdown of A3A impairs pro-inflammatory phenotype of M1 macrophages.
a A3A KD decreases TNF-α secretion by M1 macrophages from normal donors compared to controls (SC). P = 0.0049, Paired t test, two-tailed, n = 5 donors. b A3A KD decreases IL-1β secretion by M1 macrophages from normal donors compared to controls (SC). P = 0.0103, Paired t test, two-tailed, n = 6 donors. c A3A KD decreases IL6 secretion by M1 macrophages from normal donors compared to controls (SC). P = 0.0192, Paired t test, two-tailed, n = 6 donors. d A3A KD reduces CD86 surface protein expression in M1-macrophages by flow cytometry. Cytokines are measured by ELISA (see the “Methods” section). e The quantification of CD86 (P = 0.0395, Paired t test, two-tailed, n = 5 donors) is made using flow cytometry (see the “Methods” section) following M1 polarization in CD33-positive cells. MFI = mean (geometric) Fluorescent Intensity. M2 macrophage data from a smaller number of donors (n = 2–4) highlight low expression levels of inflammatory markers in M2. Data in scatter dot plots with mean ± SD.

