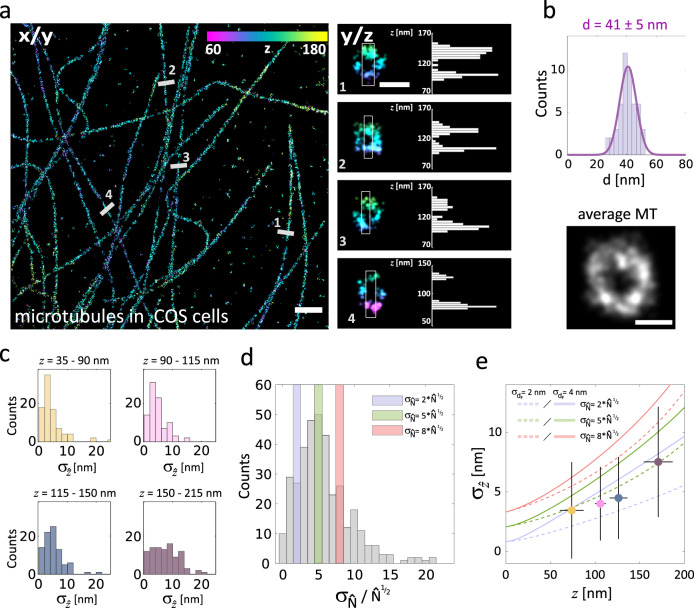
Fig. 3. Microtubules immunolabeled for DNA-PAINT super-resolved in 3D using SIMPLER.
a Microtubules in COS-7 cells. Left: top view. Right: magnified side-views along the numbered lines in the top view, together with the axial profile of the boxed areas. Top- and side-views have the same z-colour scale. Three independent experiments were performed with similar results. b Distribution of microtubule diameters (n = 50), with an average of 41 nm and a standard deviation of 6 nm. An average (n = 8) microtubule profile is also shown. c Histograms of at different z-positions, obtained experimentally from 366 DNA-PAINT single-molecule traces. Data include traces from microtubules in COS-7 cells, as well as from spectrin in hippocampal neurons (Fig. 2d). d Histogram of the experimentally determined variance of (), expressed in units of to remark how much larger is with respect to the expected theoretical lower bound (). The values 2, 5 and 8 are highlighted. The variance was obtained from the same 366 single-molecule traces as those analysed in c. e Median values located in the median z-position of each interval defined in c, overlapped with theoretical curves of for 0 = 51,000 and = 2x, 5x or 8x for σdF = 2 and 4 nm. Error bars represent the standard deviation of and z. The number of single-molecule traces analysed in each interval was 93 (for z = 35–90 nm); 90 (for z = 90–115 nm); 87 (for z = 115–150 nm); and 96 (for z = 150–225 nm). Data includes localizations from three biologically independent samples (immunolabeled microtubules in two independent COS-7 cells and immunolabeled spectrin in a hippocampal neuron). Scale bars represent 1 µm (a, top view); 50 nm (a, side view) and 25 nm (b). Number of localizations kept after frame-filtering step: a (1) 176 (out of 292), (2) 257 (out of 433), (3) 131 (out of 294) and (4) 85 (out of 275).

