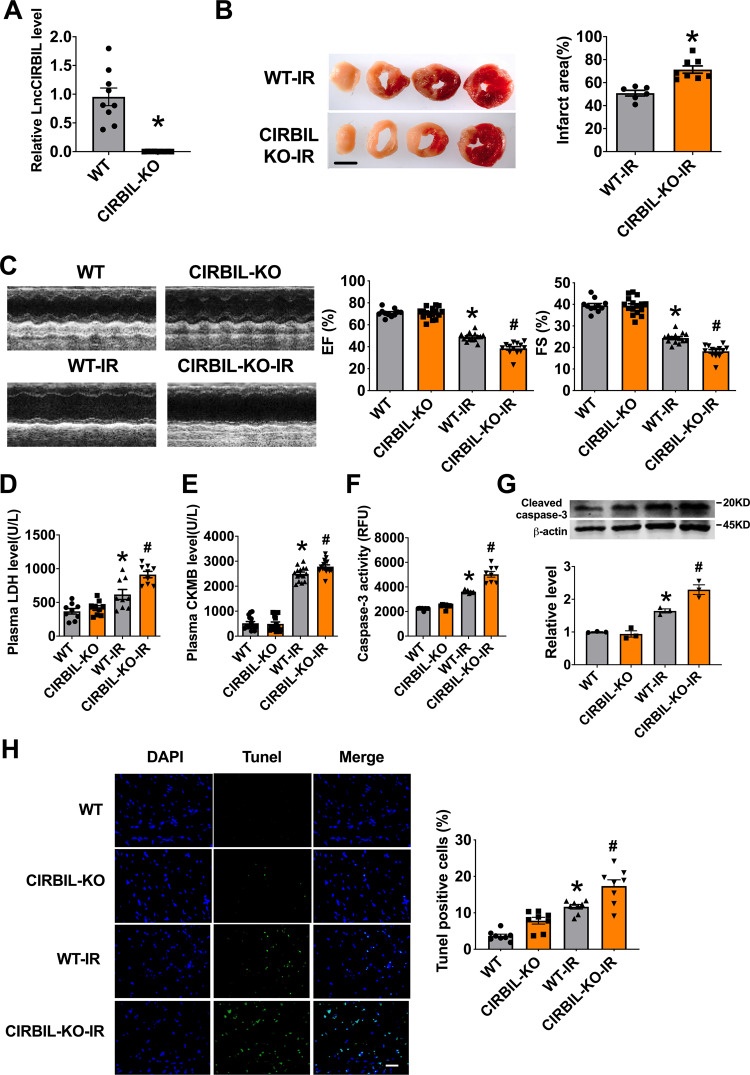
Fig. 2. Knockout of lncCIRBIL exacerbates cardiac ischemia–reperfusion injury.
A LncCIRBIL levels in the hearts of lncCIRBIL knockout and wild-type (WT) mice. N = 9. *P < 0.05 versus WT group. P values were determined by unpaired t test. B Infarct size of I/R hearts stained with TTC (scale bar: 2 mm). WT-I/R N = 6, CIRBIL-KO-I/R N = 8. *P < 0.05 versus WT-IR mice. P values were determined by unpaired t test. C Representative images of echocardiographs and statistics of ejection fraction (EF) and fractional shortening (FS). WT N = 11, CIRBIL-KO N = 16, WT-I/R N = 14, CIRBIL-KO-I/R N = 13. *P < 0.05 versus WT; #P < 0.05 versus WT-IR mice. P values were determined by one-way ANOVA test followed by Bonferroni post hoc analysis. D Serum concentrations of LDH, respectively. N = 9 mice per group. *P < 0.05 versus WT; #P < 0.05 versus WT-IR mice. P values were determined by one-way ANOVA test followed by Bonferroni post hoc analysis. E Serum concentrations of CKMB, respectively. N = 15 mice per group. *P < 0.05 versus WT; #P < 0.05 versus WT-IR mice. P values were determined by one-way ANOVA test followed by Bonferroni post hoc analysis. F Caspase-3 activity. N = 8 mice per group. *P < 0.05 versus WT-IR mice. P values were determined by one-way ANOVA test followed by Bonferroni post hoc analysis. G Cleaved caspase-3 protein level. N = 3 mice per group. *P < 0.05 versus WT-IR mice. P values were determined by one-way ANOVA test followed by Bonferroni post hoc analysis. H Apoptosis of cardiomyocyte in the border zone (BZ) by TUNEL staining (scale bar: 20 μm). N = 8 mice per group. *P < 0.05 versus WT; #P < 0.05 versus WT-IR mice. P values were determined by one-way ANOVA test followed by Bonferroni post hoc analysis. Data are expressed as mean ± SEM. CIRBIL-KO CIRBIL knockout mice, CIRBIL-KO-IR CIRBIL knockout mice with ischemia–reperfusion.

