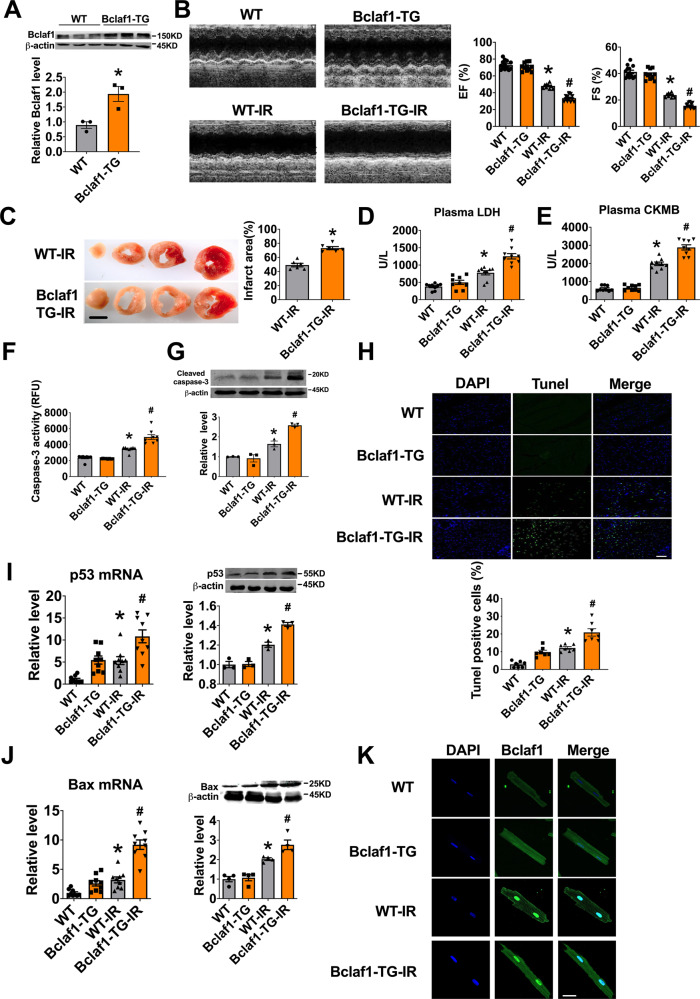
Fig. 4. Cardiomyocyte-specific transgenic overexpression of Bclaf1 aggravates cardiac ischemia–reperfusion injury.
A Bclaf1 protein level determined by western blot. N = 3. *P < 0.05 versus WT group. P values were determined by unpaired t test. B Representative images of echocardiographs and statistics of ejection fraction (EF) and fractional shortening (FS). WT N = 13, Bclaf1-TG N = 11, WT-I/R N = 10, Bclaf1-TG-I/R N = 13. *P < 0.05 versus WT, #P < 0.05 versus WT-IR mice. P values were determined by one-way ANOVA test followed by Bonferroni post hoc analysis. C Infarct area determined by TTC staining (scale bar: 2 mm). N = 6 mice per group. *P < 0.05 versus WT-IR mice. P values were determined by unpaired t test. D, E Serum concentrations of LDH and CKMB, respectively, measured by Elisa assay. N = 9 mice per group. *P < 0.05 versus WT, #P < 0.05 versus WT-IR mice. P values were determined by one-way ANOVA test followed by Bonferroni post hoc analysis. F, G Caspase-3 activity and cleaved caspase-3 protein level, respectively. N = 8 mice per group for caspase activity, and N = 3 mice for cleaved caspase-3 protein level. *P < 0.05 versus WT, #P < 0.05 versus WT-IR mice. P values were determined by one-way ANOVA test followed by Bonferroni post hoc analysis. H Apoptosis of cardiomyocyte in the border zone (BZ) by TUNEL staining (scale bar: 20 μm). N = 7 mice per group. *P < 0.05 versus WT, #P < 0.05 versus WT-IR mice. P values were determined by one-way ANOVA test followed by Bonferroni post hoc analysis. I mRNA and protein levels of p53 by RT-PCR and western blot. N = 9 for PCR, N = 3 for western blot. *P < 0.05 versus WT, #P < 0.05 versus WT-IR mice. P values were determined by one-way ANOVA test followed by Bonferroni post hoc analysis. J mRNA and protein levels of Bax by RT-PCR and western blot. N = 9 for PCR, N = 4 for western blot. *P < 0.05 versus WT, #P < 0.05 versus WT-IR mice. P values were determined by one-way ANOVA test followed by Bonferroni post hoc analysis. K Distribution of Bclaf1 in isolated cardiomyocytes (scale bar: 20 μm). Data are expressed as mean ± SEM.

