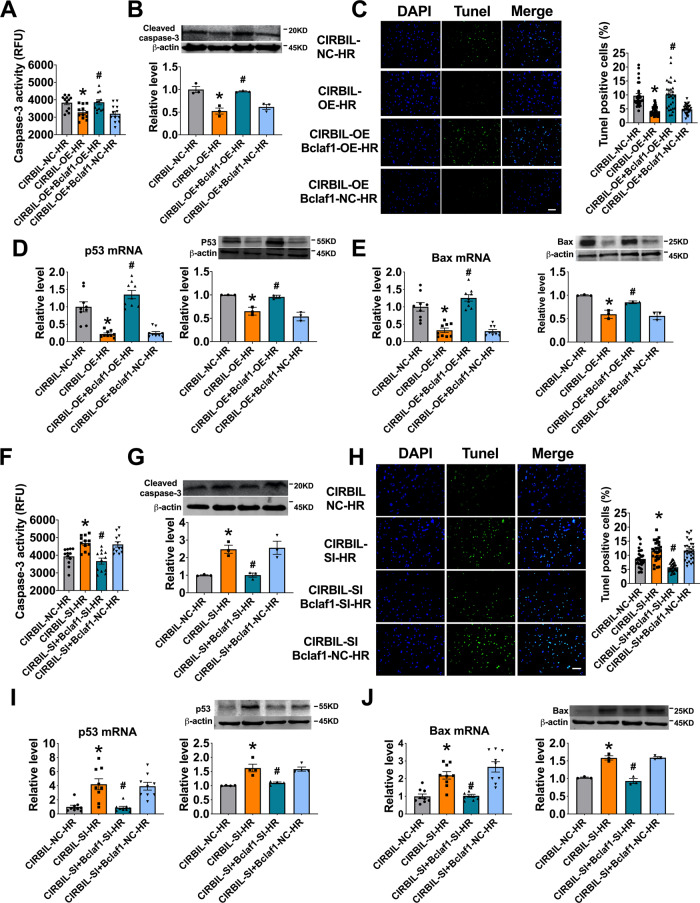
Fig. 6. Bclaf1 mediates the regulation of lncCIRBIL on cardiomyocyte injury induced by hypoxia/reoxygenation.
A, B Caspase-3 activity and cleaved caspase-3 protein level in cardiomyocytes co-transfected with lncCIRBIL- and Bclaf1-overexpressing plasmids. N = 12 from 3 independent cultures for caspase-3 activity, N = 3 for cleaved caspase-3 protein level. NC negative control (empty plasmid), OE lncCIRBIL overexpression plasmids. *P < 0.05 versus lncCIRBIL-NC-HR. #P < 0.05 versus lncCIRBIL-OE-HR group. P values were determined by one-way ANOVA test followed by Bonferroni post hoc analysis. C Cardiomyocyte apoptosis by TUNEL staining (scale bar: 20 μm). N = 10, from 3 independent cultures. NC negative control (empty plasmid), OE lncCIRBIL overexpression plasmids. *P < 0.05 versus lncCIRBIL-NC-HR, #P < 0.05 versus lncCIRBIL-OE-HR. P values were determined by one-way ANOVA test followed by Bonferroni post hoc analysis. D, E The mRNA and protein expression of p53 and Bax by qRT-PCR and western blot, respectively. N = 9 for qRT-PCR, and N = 3 for western blot. NC negative control (empty plasmid), OE lncCIRBIL overexpression plasmid. *P < 0.05 versus lncCIRBIL-NC-HR, #P < 0.05 versus lncCIRBIL-OE-HR. P values were determined by one-way ANOVA test followed by Bonferroni post hoc analysis. F, G Caspase-3 activity and cleaved caspase-3 protein level in cardiomyocytes co-transfected with lncCIRBIL siRNA and Bclaf1 siRNA. N = 12 from 3 independent cultures for caspase-3 activity, N = 3 for cleaved caspase-3 protein level. NC negative control. *P < 0.05 versus lncCIRBIL-NC-HR, #P < 0.05 versus lncCIRBIL-SI-HR. P values were determined by one-way ANOVA test followed by Bonferroni post hoc analysis. H Cardiomyocyte apoptosis by TUNEL staining (scale bar: 20 μm). N = 10 form 3 independent cultures. NC negative control. *P < 0.05 versus lncCIRBIL-NC-HR, #P < 0.05 versus lncCIRBIL-SI-HR. P values were determined by one-way ANOVA test followed by Bonferroni post hoc analysis. I, J The mRNA and protein expression of p53 and Bax by qRT-PCR and western blot, respectively. N = 9 for qRT-PCR, and N = 3 for western blot, from 3 independent batches of cells. NC negative control. *P < 0.05 versus lncCIRBIL-NC-HR, #P < 0.05 versus lncCIRBIL-SI-HR. P values were determined by one-way ANOVA test followed by Bonferroni post hoc analysis. Data are expressed as mean ± SEM.

