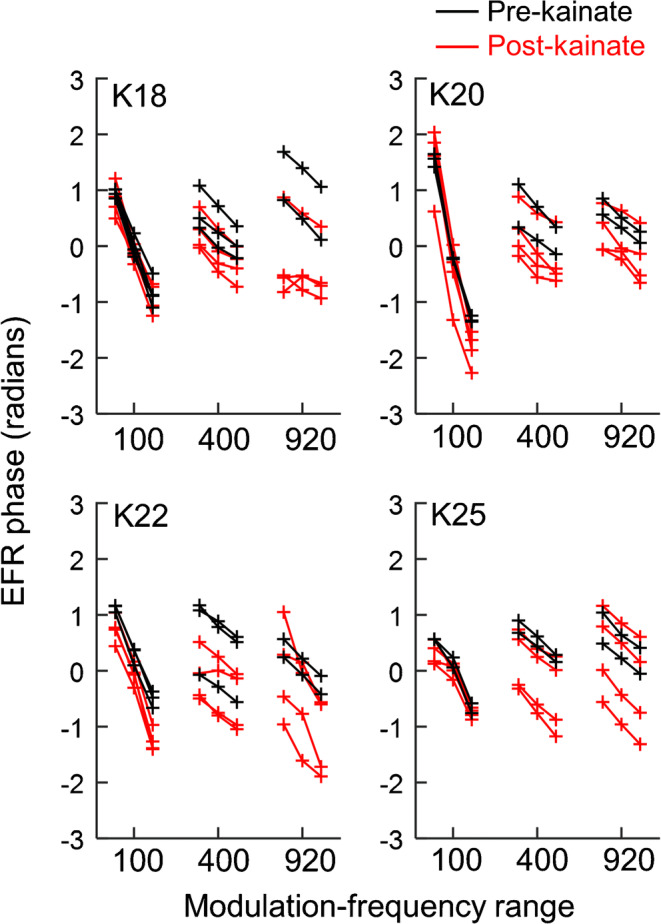
Fig. 3.

EFR phase among individual animals. Raw phase measurements across repeated recording sessions conducted before and ≥ 4 weeks after bilateral kainate exposure are shown for each animal in four respective plots with neighboring data points separated by 20 Hz as in Fig. 2. Modulation frequency ranges are indicated using the middle value for each range. The slope of the relationship between EFR phase and stimulus modulation frequency is similar before and after kainate exposure, suggesting no change in the primary site of EFR generation
