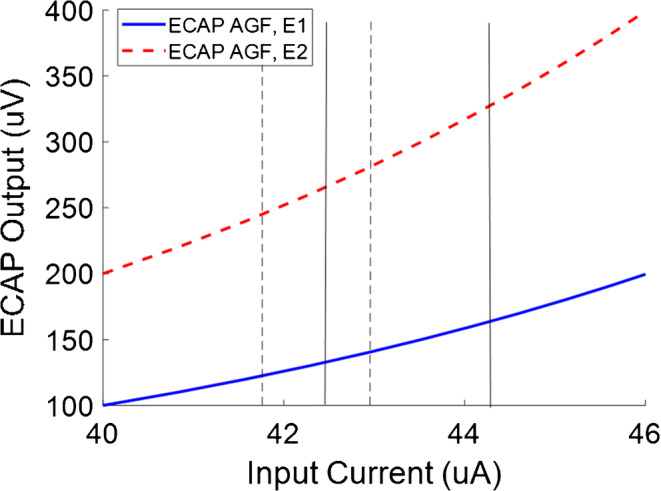
Fig. 2.

The curves above represent ECAP AGFs for two electrodes, E1 and E2, where the ECAP output is twice as large for E2. If the ECAP output is larger for E2 than E1 because of differences in recording electrode characteristics, the AGF will be measured over the same input current range for the two electrodes. If the ECAP output is larger for E2 than E1 because of differences in stimulating electrode characteristics, the AGF will be measured over different input current ranges for the two electrodes. For example, E1 may be measured using the stimulus range indicated by the solid vertical lines, whereas E2 may be measured over the range between the dashed lines. This will reduce the difference between the measured slopes of the two functions
