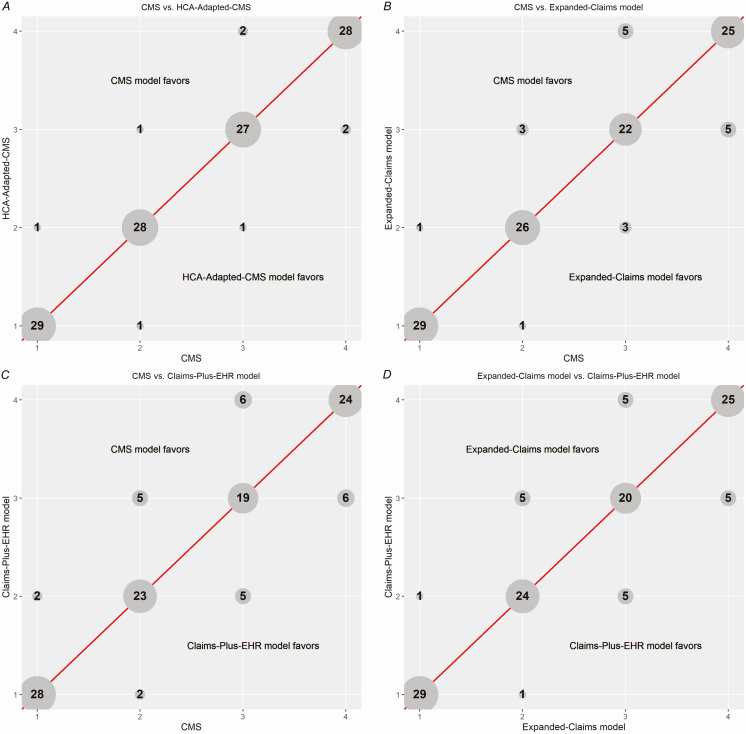
Figure 1.
A–D, Comparison of hospital rankings, in quartiles, between the CMS model, HCA-adapted CMS model, expanded claims model, and claims-plus-EHR model. The number in each circle represents the number of hospitals that fall into the quartiles indicated on each axis, with “1” being the best-performing quartile and “4” being the worst-performing quartile. Each axis represents the resulting hospital rankings of 1 of the 4 modeling approaches used in this study. Abbreviations: CMS, Centers for Medicare and Medicaid Services; EHR, electronic health record; HCA, HCA Healthcare.

