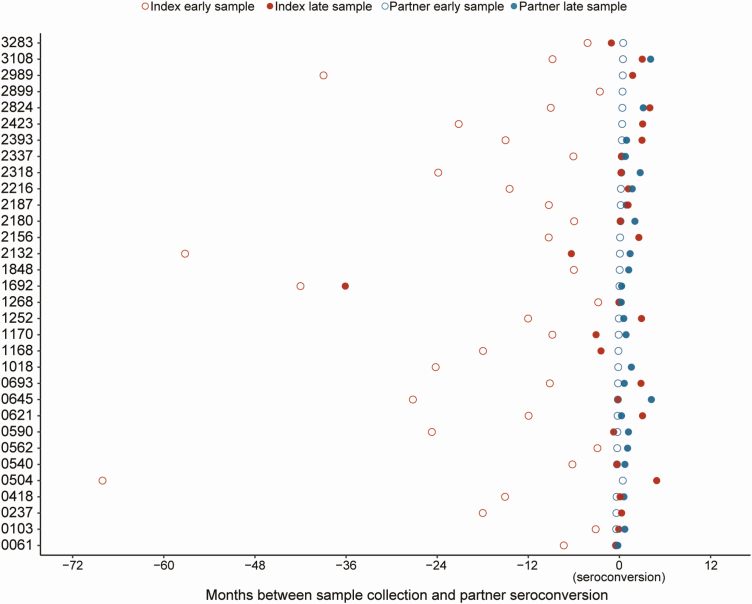
Figure 2.
The plot shows the timing of sample collection for 32 couples. Index participants were human immunodeficiency virus (HIV) positive at study enrollment; partners were HIV negative at study enrollment. Next-generation sequencing data were obtained for 105 unique sample pairs (32 index early/partner early; 24 index early/partner late; 28 index late/partner early; 21 index late/partner late). Data from each couple are shown in 1 row; couple identifiers are shown on the y-axis. The x-axis shows the number of months between sample collection and partner seroconversion; negative numbers indicate that samples were collected before partner seroconversion. Partner samples used for these analyses were collected at the first HIV-positive visit (early) and at a subsequent study visit (late) at/after time of seroconversion. Index samples used for these analyses were collected at an earlier study visit (early) or near the time of partner seroconversion (late). Index samples are shown in red; partner samples are shown in blue. Early samples are shown with open circles; late samples are shown with filled circles.

