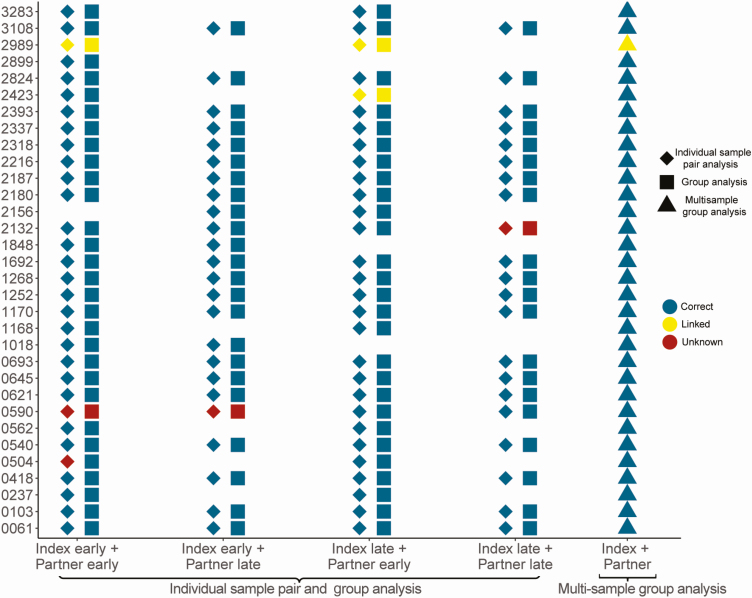
Figure 3.
Inferred direction of transmission using different sample sets. The plot shows the inferred relationship between sequences from each couple based on analysis of data from different sample sets using a window width of 320 bp (individual sample pair analysis and group) and 380 bp (multisample group analysis). Each symbol (diamond, square, or triangle) represents the inferred relationship based on a single analysis; data from each couple are shown in 1 row, with participant identifier numbers shown on the y-axis. Diamonds show results obtained using data from individual sample pairs (1 sample per participant; 1 couple per analysis); squares show results obtained using group analysis (samples selected based on the timing of sample collection; all couples combined); triangles show results obtained using multisample group analysis (up to 2 samples per participant, all couples combined). Colors of symbols correspond to the inferred transmission direction: blue symbols indicate the correct inferred direction; yellow symbols indicate pairs that were classified as linked with no direction inferred; red symbols indicate that the analysis did not yield a result for linkage or transmission direction. Blank spaces indicate that the specific combination of samples (eg, index early+partner late) was not available for analysis.

