
Figure 2.
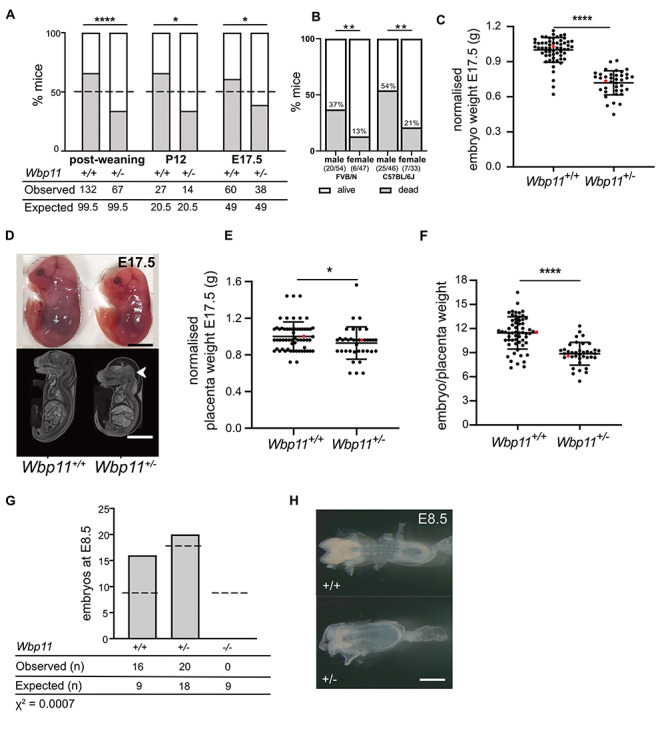
Wbp11−/− and Wbp11+/− embryos and mice do not survive in expected numbers. (A) Number of Wbp11+/− and Wbp11+/+ mice observed compared with the expected Mendelian ratio (dotted line) at E17.5 (backcross 2, *P = 0.0263), P12 (backcross 2, *P = 0.0412) and post-weaning (backcrosses 1 and 2, ****P = 0.0001). Deviation from expected Mendelian ratios for the Wbp11+/− × Wbp11+/+ breeding scheme was calculated by chi-squared test. Dead mice that could not be genotyped were omitted. (B) Percentage of male and female Wbp11+/− mice that died postnatally. On the left, FVB/N background backcrosses 1–4, **P = 0.0063. On the right, C57BL/6J background crosses 1–4, **P = 0.0049. Fisher’s exact test was used to determine significance. (C) Comparison of Wbp11+/+ and Wbp11+/− embryo weights at E17.5 normalized to average wildtype body weight (n = 98, ****P < 0.0001). (D) Photomicrographs and contrast-enhanced micro-computed tomography (micro-CT) scans of E17.5 embryos illustrating the smaller size of Wbp11+/− embryos and the presence of edema (arrowhead) compared with wildtype embryos from the same litter. (E) Placenta weight of E17.5 embryos (FVB/N) after dissection, normalized to average wildtype placenta weight (n = 98, *P = 0.0239). (F) Wbp11+/− and Wbp11+/+ E17.5 embryo weights normalized to the weights of their placentas (****P < 0.0001). (G) Embryo genotypes observed at E8.5 in litters from Wbp11+/− × Wbp11+/− matings (backcrosses 2 and 3). Deviation from expected Mendelian ratios (dotted lines) was calculated by chi-squared test (P = 0.0007). (H) Photomicrographs of Wbp11+/− and wildtype E8.5 embryos. Error bars represent SD. (C, E and F) Unpaired t-test was used to determine significance, and red dots indicate the embryos in (D). Scale bars: 5 mm (D), 500 μm (H).