
Figure 5.
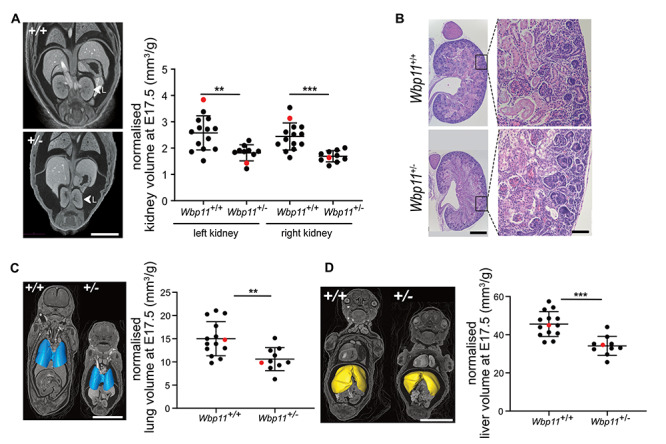
Kidney defects are present in E17.5 Wbp11+/− embryos. (A) Anterior view of micro-computed tomography (micro-CT) reconstructions comparing kidney morphology between Wbp11+/+ and Wbp11+/− littermates at E17.5. Left kidney is indicated. Graph shows comparison of volume measurements of left and right kidneys in Wbp11+/+ and Wbp11+/− littermates at E17.5 (left kidney, **P = 0.0024; right kidney, ***P = 0.0002). Red dots indicate the embryos on the left. (B) Histological sections (sagittal) stained with hematoxylin and eosin of an E17.5 kidney from Wbp11+/+ (top two panels) and Wbp11+/− embryos (bottom two panels). Whole kidney micrographs (left) and high magnifications (right) are shown. (C) 3D surface view of the lungs combined with micro-CT reconstruction slice (anterior view). Volume measurements of the lungs from Wbp11+/+ and Wbp11+/− littermates at E17.5 (**P = 0.0034). Red dots indicate embryos on the left. (D) 3D surface view of the liver combined with micro-CT reconstruction slice (anterior view). Volume measurements of the livers from Wbp11+/+ and Wbp11+/− littermates at E17.5 (***P = 0.0001). Red dots indicate embryos on the left. Embryos included in this data are from the second backcross. Kidney, lung and liver volumes were normalized against the embryo weight. Unpaired t-test was performed to determine statistical significance. Scale bars: 2 mm (A), whole kidney = 500 μm and high magnification = 100 μm (B), 5 mm (C, D). Error bars represent standard deviation (SD).