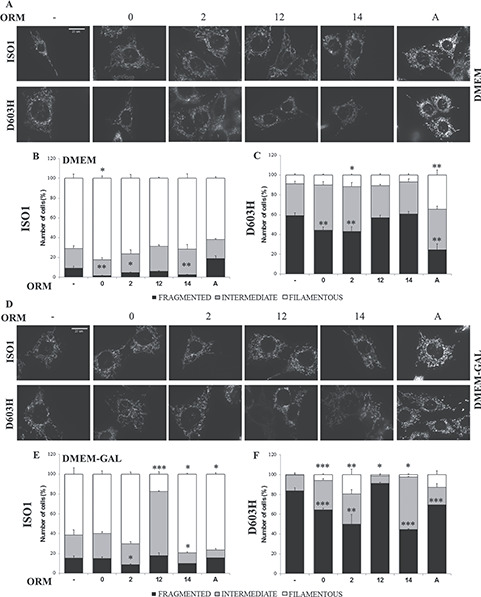
Figure 3.

Mitochondrial network morphology of MEFs bearing the indicated OPA1 mutations incubated with ORMs. (A, D) Representative images of mitochondrial network of ISO1 and D603H MEFs after labeling with Mitotracker Red. MEFs lines were incubated for 24 h in DMEM (B, C) or in DMEM-galactose (E, F) in absence or presence of the ORMs. Cells were scored in three categories on the basis of mitochondrial network morphologies: cells with filamentous and interconnected network (filamentous), cells with short filamentous mitochondria (intermediate) and cells with fragmented mitochondria (fragmented). 100–120 cells were analyzed for ISO1 (B–E) and D603H (C–F) MEFs in each condition and for each experiment. Data are means ± SEM of 3–4 independent experiments. *P < 0.05, **P < 0.01, ***P < 0.001.
