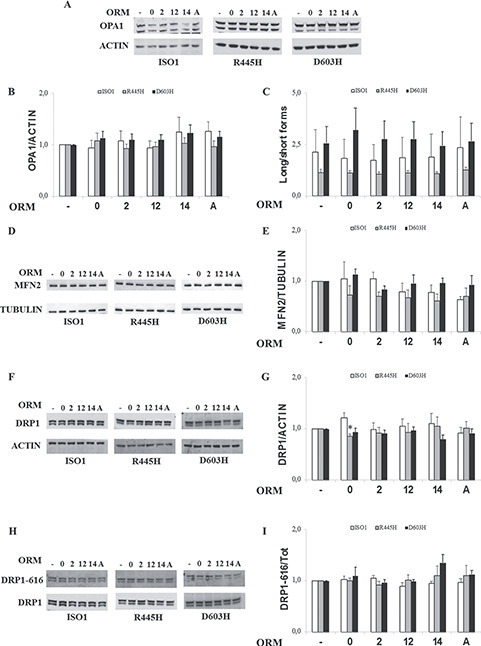
Figure 4.

Levels of mitochondrial shaping proteins in MEFs bearing the indicated OPA1 mutations incubated with ORMs. MEFs were incubated for 24 h in DMEM-galactose in the absence or presence of ORMs. (A, D, F, H) Representative blots of OPA1, MFN2, DRP1 and DRP1-P-S616. ACTIN or TUBULIN were used as a loading control. (B, E, G) Densitometric analysis of OPA1, MFN2 AND DRP1 protein levels. Data are normalized to those of untreated cells in DMEM-galactose. Values are means ± SEM (n = 3–6). *P < 0.05, one simple t test. (C) Densitometric analysis of OPA1 long-/short-forms ratio. Values are means ± SEM (n = 4–6). (I) Densitometric analysis of DRP1-P-S616/DRP1 ratio. Values are means ± SEM (n = 3).
