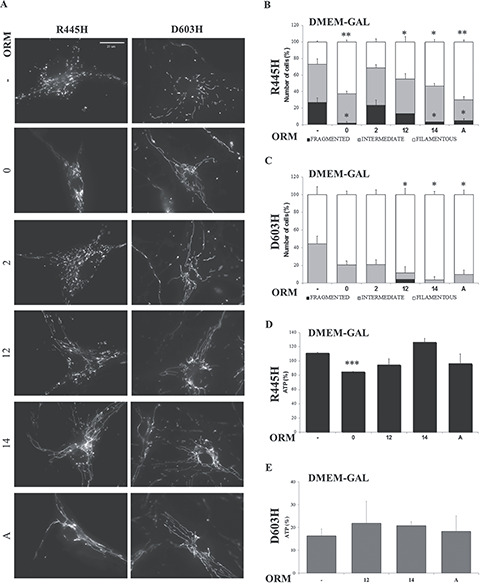
Figure 8.

Effects of the ORMs in DOA patients’ fibroblasts. (A) Representative images of mitochondrial network of fibroblasts loaded with Mitotracker Red. (B, C) 60–80 cells were analyzed for R445H and D603H fibroblasts in each condition. Data are means ± SEM of three independent experiments. (D, E) Cellular ATP levels of R445H and D603H fibroblasts after 24 h incubation in DMEM-galactose in the absence or presence of ORMs. Data are expressed as percent of ATP content measured in DMEM-glucose at time = 0; values are means ± SEM of three experiments. *P < 0.05, **P < 0.01, ***P < 0.001.
