
Figure 4.
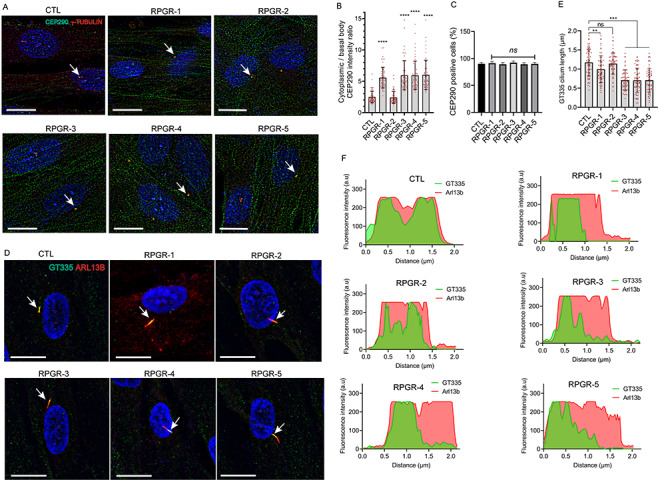
Distribution of ciliary markers. CEP290 (A–C) and GT335 (D–F) staining in the indicated fibroblasts was assessed. (A) The cells were stained with CEP290 (green) and γ-tubulin (basal body marker, red) antibodies and the ratio of the CEP290-positive signal in the cytoplasm to that at the basal body (B) and the number of CEP290-positive cells (C) were quantified using ImageJ (n > 100). (D) The cells were stained with GT335 (green, glutamylated tubulin) and ARL13B (red, cilia marker). (E) The distribution of GT335 (green signal intensity) along the length of the cilium when compared with ARL13B (red intensity) (distance, μm) was quantified using IMARIS software (Oxford Instruments). a.u., arbitrary units.