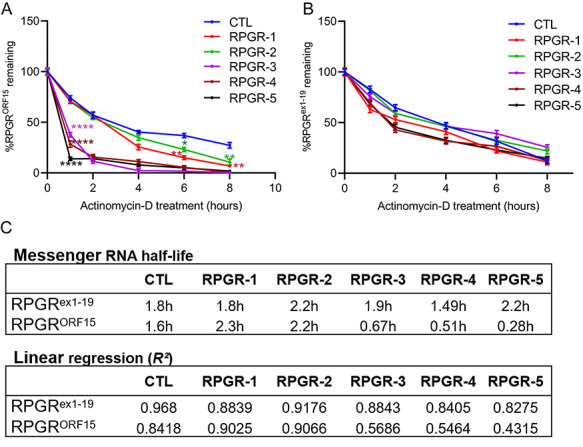
Figure 6.

Mutant mRNA decay in RPGRORF15 fibroblasts. Quantitative PCR analysis of RPGRORF15 (A) or RPGRex1-19 (B) isoform was performed in fibroblasts treated with actinomycin D for indicated time. The levels of the mutant isoforms were calculated relative to the levels in the control (CTL) fibroblasts at the same time points. Statistical significance was determined by assessing the mRNA levels at each time point relative to that of the control (CTL) at the same time point. ****P < 0.0001; **P < 0.01; *P < 0.05. No significant changes in the degradation of RPGRex-19 mRNA were detected at the same time points (B). (C) The half-life and linear regression of the mutant RPGRORF15 and RPGRex1-19 mRNAs was calculated by determining the time (in hours) taken by the isoforms to reduce to half the original levels.
