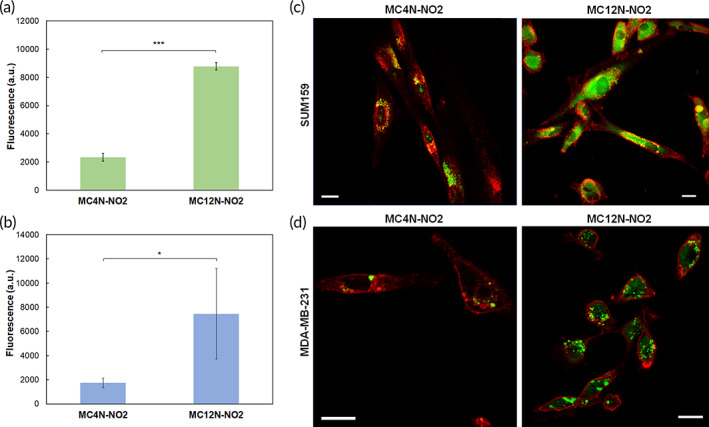
FIGURE 3.

Cell uptake of MC4N‐NO2 spherical micelles and MC12N‐NO2 cylindrical micelles. Flow cytometry results after 24 h at 37°C for (a) SUM159 cells, and (b) MDA‐MB‐231 cells. The cell autofluorescence was subtracted from all samples. Data are presented as the mean ± SD (n = 3–5). Two‐tailed Student's t‐test analysis was used to determine significance, * p < 0.05, *** p < 0.00001. Confocal microscopy images of MC4N‐NO2 spherical micelles and MC12N‐NO2 nanofibers incubated for 24 h at 37°C with (c) SUM159, and (d) MDA‐MB‐231 cells. Nanoparticles are shown in green and cell membranes in red. Scale bars are 20 μm
