FIGURE 5.

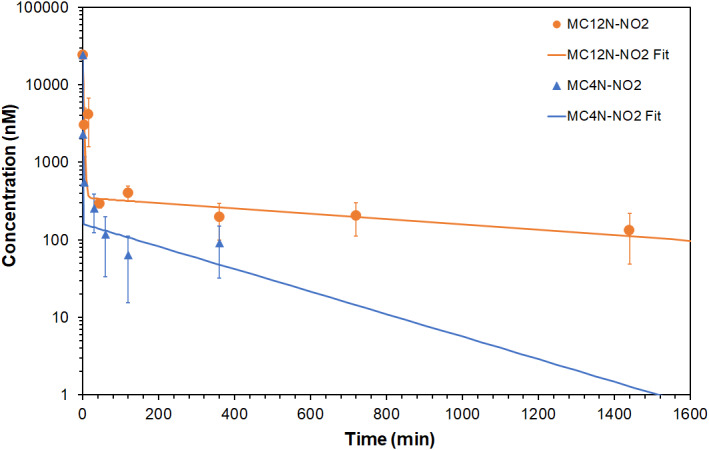
In vivo clearance of MUC1 aptamer nanoparticles. Plasma aptamer‐amphiphile concentration versus time after intravenous injection. Data are presented as mean ± SD (n = 3–4). The lines are fits to a two‐compartment model

In vivo clearance of MUC1 aptamer nanoparticles. Plasma aptamer‐amphiphile concentration versus time after intravenous injection. Data are presented as mean ± SD (n = 3–4). The lines are fits to a two‐compartment model