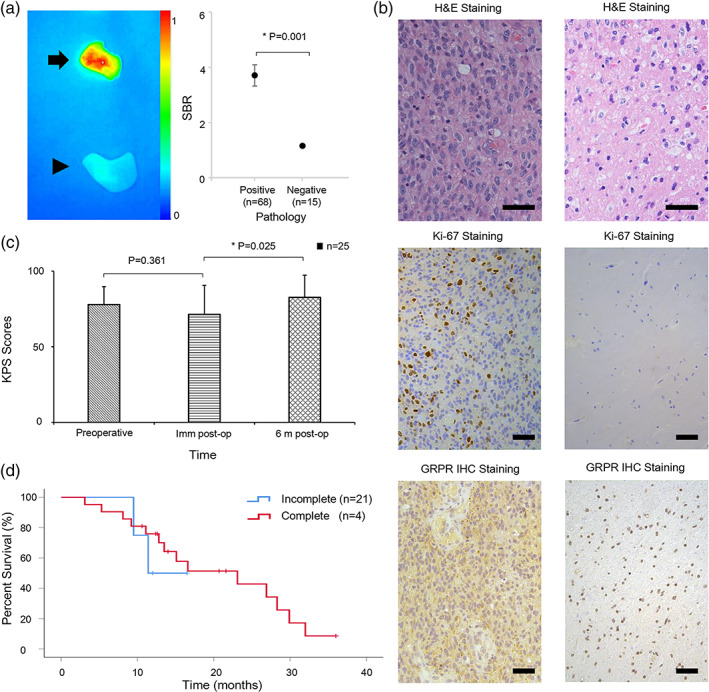
FIGURE 3.

Pathology results and patients' Karnofsky performance status (KPS) scores and survival curve. (a) In the left subgraph, fluoresce profile of a representative true positive specimen (arrow) and true negative specimen (arrowhead); in the right subgraph, SBR values of true positive specimens and true negative specimens of all patients. (b) H&E, Ki‐67 and GRPR IHC staining results of specimens in panel A. Scale bar, 50 μm. The positive specimen was confirmed by H&E and Ki‐67 staining and had a large number of GRPR positive cells (left column), while the negative specimen only had a few (right column). (c) Preoperative, immediate postoperative, and 6‐month postoperative KPS scores. (d) Kaplan–Meier plots of overall times stratified by extent of tumor resection
