
FIGURE 2.
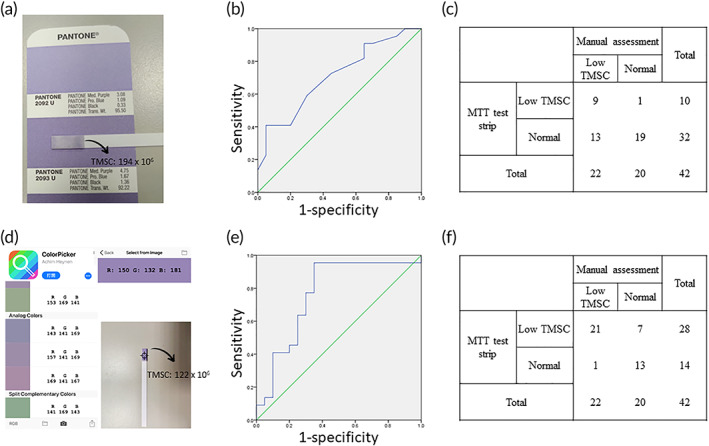
Two‐image readout system and MTT test strip results differentiate normal and low total motile sperm concentration (TMSC) semen samples. (a) The red/green/blue (RGB) colorimetric results recorded using pantone color chips (b) The receiver operating characteristic (ROC) curve based on visual observation of the MTT test strip to differentiate normal and low total motile sperm concentration (TMSC, < 20 × 106 spermatozoa) in semen samples. (AUC = 0.71; 95% of confidence interval = 0.55–0.86; p = 0.021) (c) The confusion matrix of the results based on visual observation. (sensitivity = 41%; specificity = 95%; positive predictive value (PPV) = 90%; negative predictive value (NPV) = 59.4%; accuracy = 67%) (d) The RGB scale of the colorimetric results recorded via smartphone. The arrow in the middle part of the ColorPicker application can be used to analyze the RGB scale of the loaded picture. (e) ROC curve of an MTT test strip analyzed with the smartphone‐based recording and analytical system to differentiate normal and low TMSC semen samples. (AUC = 0.766; 95% of confidence interval = 0.612–0.92; p = 0.003) (f) The confusion matrix of the results recorded using the smartphone‐based recording and analytical system (sensitivity = 96%; specificity = 65%; PPV = 75%; NPV = 92.9%; accuracy = 80.9%). In figure (c), (f), the RGB threshold that separates patients predicted as normal TMSC status and low TMSC status was determined by the point on the ROC curve that maximized sensitivity and specificity. MTT, 3‐(4,5‐Dimethyl‐2‐thiazolyl)‐2,5‐diphenyl‐2H‐tetrazolium bromide