FIGURE 2.

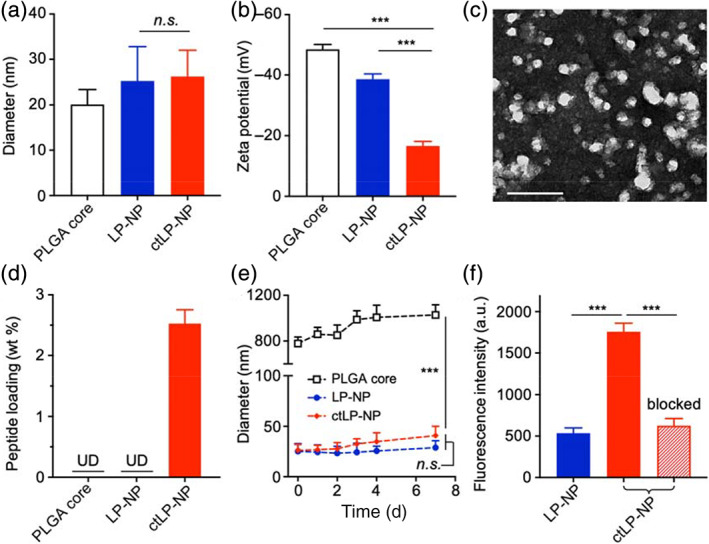
Characterization of ctLP‐NPs. (a) Hydrodynamic size (diameter) of PLGA cores, LP‐NPs, and ctLP‐NPs, respectively. (b) Zeta potential (mV) of different nanoparticle groups. (c) A representative TEM image of ctLP‐NPs with uranyl acetate staining (scale bar, 50 nm). (d) Quantification of protein content on PLGA cores, LP‐NPs, and ctLP‐NPs, respectively, using a BCA assay (UD, undetectable). (e) The hydrodynamic size of PLGA cores, LP‐NPs, and ctLP‐NPs in 1× PBS over a week. (f) Fluorescence intensity of DiD‐labeled LP‐NPs and ctLP‐NPs bound onto a type II collagen‐coated plate. As an additional control (labeled with “blocked”), the plate was pretreated with free peptide to block the collagen before adding ctLP‐NPs. Data presented as mean ± SD (n = 3); n.s.: not significant; ***p < 0.001; statistical analysis by one‐way ANOVA
