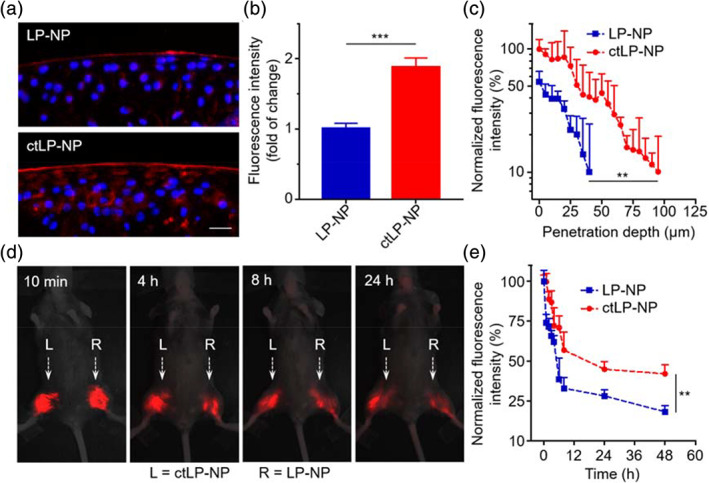
FIGURE 3.

Retention and penetration of ctLP‐NPs in the cartilage. (a) Representative fluorescence images of femoral head sections incubated with DiD‐labeled LP‐NPs (top) or ctLP‐NPs (bottom). Red represents the nanoparticles and blue represents the nuclei (scale bars: 20 μm). (b) Relative fluorescence intensity in the cartilage upon incubation with LP‐NPs or ctLP‐NPs (0.2 mg mL−1) for 24 h. (c) Quantitative analysis of nanoparticle penetration depth into femoral heads. (d) Fluorescence images of mouse knee joints after intra‐articular injection of fluorescence‐labeled ctLP‐NPs (left, L) and LP‐NPs (right, R) at different timepoints. In the study, 20 μL of 2 mg mL−1 nanoparticle suspension was injected into each joint. (e) Fluorescence intensity of the nanoparticles in the knee joints. Data presented as mean ± SD (n = 3). **p < 0.01; ***p < 0.001; statistical analysis by two‐tailed Student's t‐test
