
FIGURE 1.
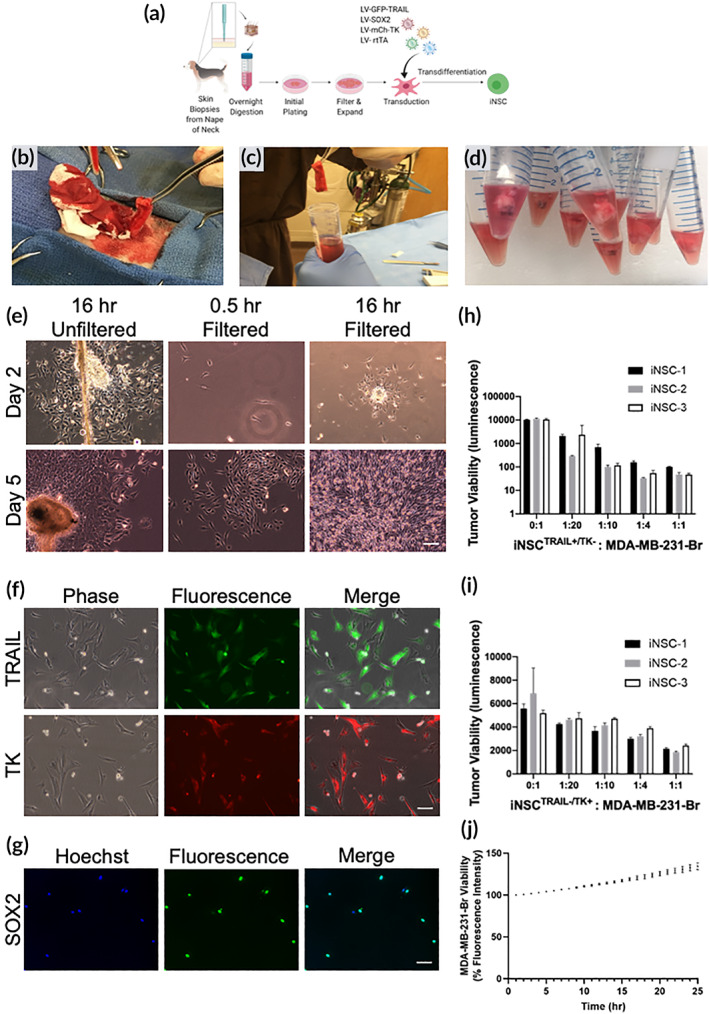
Murine proof‐of‐concept studies. (a) Schematic depicting fibroblast isolation, transduction, and transdifferentiation procedures. (b) Skin biopsy harvest from cadaver canine. (c,d) Skin samples in digestion media. (e) Cultures of primary canine fibroblasts 16 hr after plating and prior to filtering, 30 min after filtering, and 16 hr after filtering. Scale bar 100 μm. (f) Fluorescence imaging confirming TRAIL expression in fibroblasts. Scale bar 100 μm. (g) Immunofluorescence imaging of transdifferentiated fibroblasts to confirm SOX2 expression. Scale bar 50 μm. (h) Quantification of iNSCTRAIL+/TK− and MDA‐MB‐231‐Br 42 hr coculture assay. (i) Quantification of iNSCTRAIL−/TK+ and MDA‐MB‐231‐Br 72 hr coculture assay. (j) Quantification of iNSCTRAIL−/TK− and MDA‐MB‐231‐Br 25 hr coculture assay. All data presented as mean ± SD. iNSCs, induced neural stem cells; TK, thymidine kinase; TRAIL, TNFα‐related apoptosis‐inducing ligand