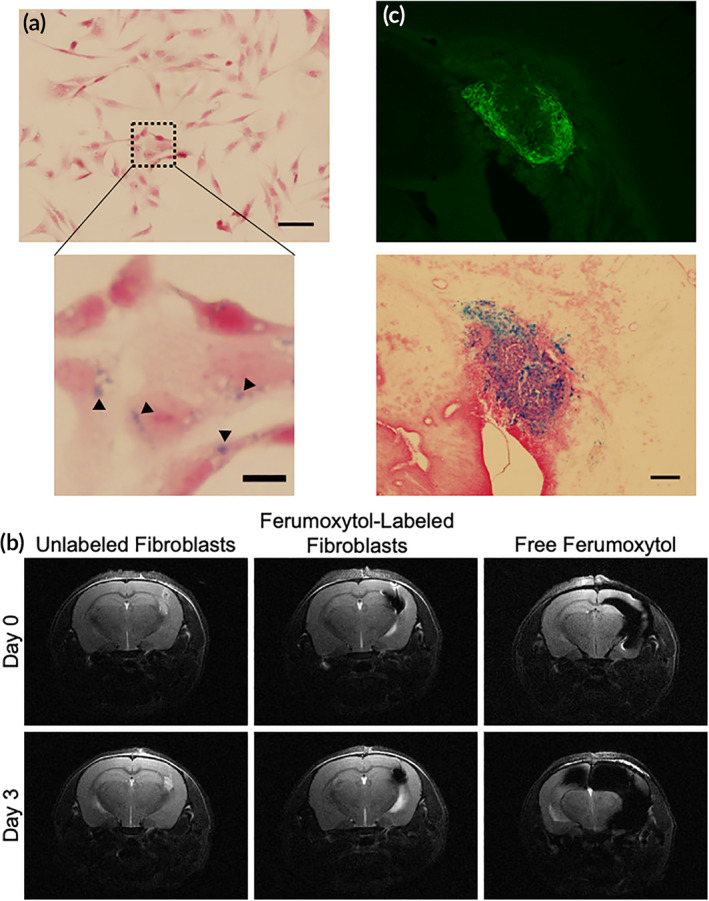
FIGURE 2.

Detection of fibroblasts via magnetic resonance imaging. (a) Prussian blue staining of ferumoxytol‐labeled fibroblasts. Scale bar 50 μm. Magnified image scale bar, 10 μm. (b) Comparison of MR images using unlabeled fibroblasts, ferumoxytol‐labeled fibroblasts, and injection of ferumoxytol suspension over 3 days. (c) Histological sections of mouse brain injected with ferumoxytol‐labeled fibroblasts. Fluorescence (top) depicts fibroblasts, and Prussian blue stain (bottom) depicts ferumoxytol particles. Scale bar 200 μm
