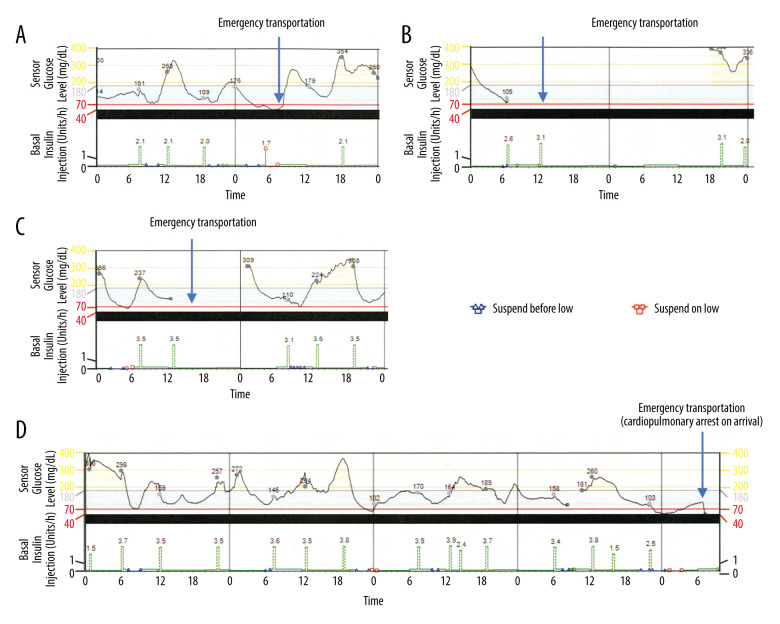
Figure 1.
The CGM of the patient. (A–C) CGM data on the day of patient referral to our Emergency Room due to hypoglycemia after starting SAP therapy with the PLGM function. The values on the graph of the sensor glucose levels show the blood glucose level measured by self-monitoring blood glucose. The values on the graph of basal insulin infusion show the units of insulin used for bolus infusion. (D) CGM data during the last 5 days before the sudden death of the patient.

