Fig. 6.
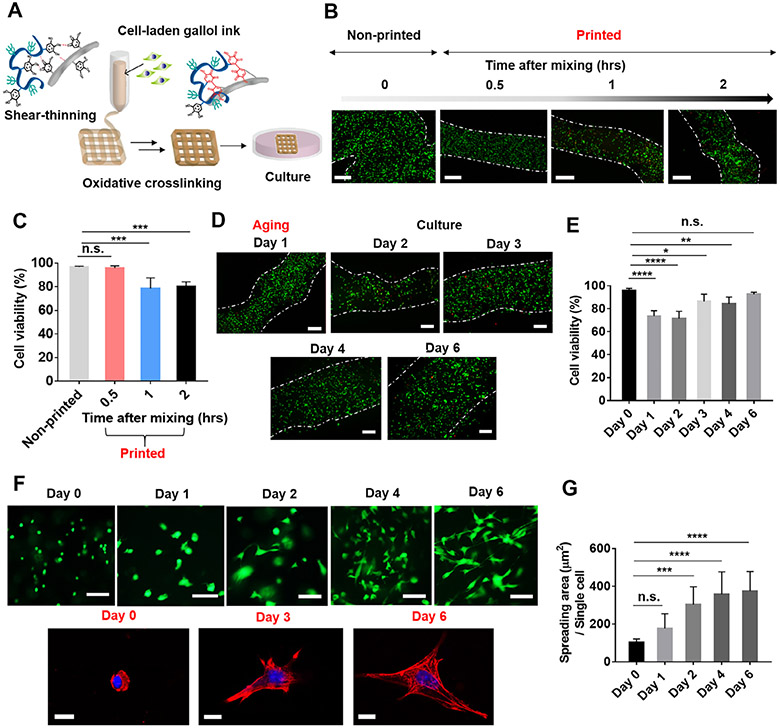
Cytocompatibility of cell-laden gallol ECM hydrogel inks. (A) Schematic description of the 3D printing of cell-laden gallol ECM inks and subsequent cell culture. (B) Fluorescent images and (C) quantification of live (green)/dead cells (red) in non-printed bulk hydrogels or printed filaments as a function of time after gel formation. (D) Fluorescent images and (E) quantification of live (green)/dead cells (red) in printed filaments after one-day of aging (Day 1) and during culture (Days 2-6). White dashed lines for (B) and (D) are approximate filament boundaries. (F) Fluorescent images of live/dead (top) and confocal images showing nuclei (blue) and F-actin (red) (bottom) of cells in printed constructs after encapsulation (Day 0) and during culture (Days 1-6). (G) Quantified spreading of the cells in printed filaments. Scale bars: 500 μm for B, D; 100 μm for top images of F; 10 μm for bottom images of F. Dunnett’s test in conjunction with one-way ANOVA, n.s. (not significant), *p < 0.05, **p < 0.01, ***p < 0.001, ****p < 0.0001.

