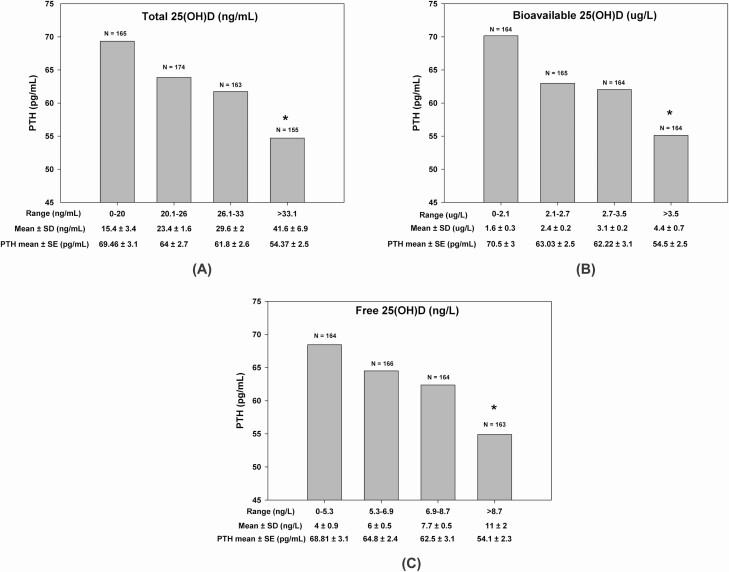
Figure 3.
The relationship between serum PTH and 25 (OH)D expressed as A, total 25(OH)D; B, bioavailable 25(OH)D; and C, free 25(OH)D, each divided into their respective quartiles. Asterisk (*) indicates significantly lower PTH levels in fourth quartile of serum total, bioavailable, and free 25(OH)D compared with the first quartile.

