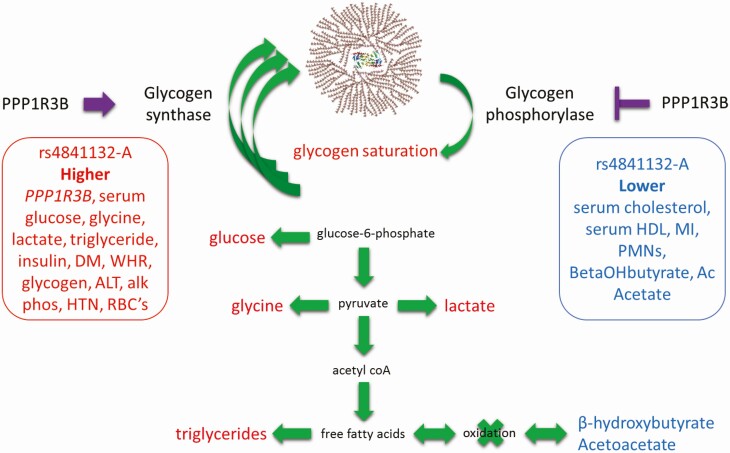
Figure 7.
Physiological model of the metabolic effects of rs4841132-A. Purple arrow and inhibition sign note putative increased and inhibitory effects of increased PPP1R3B on the enzyme activity of glycogen synthase and glycogen phosphorylase, respectively. Green arrows represent possible net flow of metabolites to account for traits, diseases, and metabolite levels seen in the population. Traits, diseases, or metabolites that are increased or decreased in the population are noted in red and blue, respectively.

