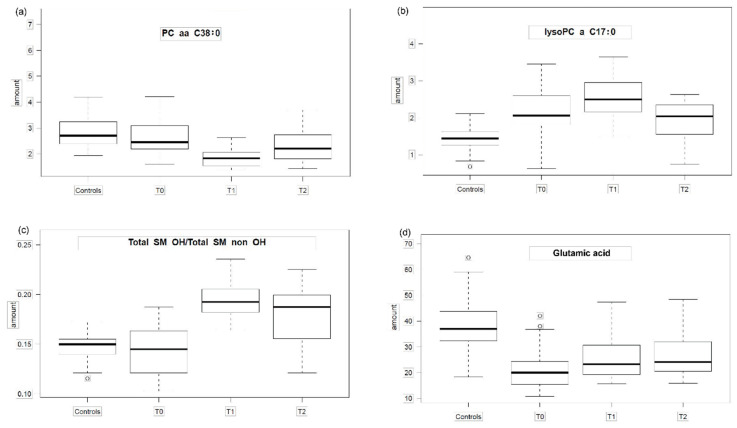
Figure 2.
The four main patterns of group means of analyte concentrations. The box plots show concentrations of analytes/metabolites (or metabolite ratios) in HC (healthy controls), T0, T1 and T2 to illustrate 4 different patterns presented in Table 3. (a) pattern group 2 (PC aa C38:0: Kruskal-Wallis test p = 2.1 × 10⁻⁸, Table S1); (b) pattern group 3 (lysoPC a C17:0 Kruskal-Wallis test p = 1.9 × 10⁻⁸); (c) pattern group 1 (total SMOH/total SM non OH Kruskal-Wallis test p = 1.0 × 10⁻¹⁰); (d) pattern group 4 (Glutamic acid Kruskal Wallis test p = 3.2 × 10⁻⁷); T0 = admission, T1 = half of target weight, T2 = long-term weight gain close to target weight. The box and whiskers plot show median (50th percentile) as line, interquartile range (IQR: 25th to the 75th percentile) as box, and minimum and maximum (for minimum and maximum values within Q3 + 1.5*IQR and Q1—1.5*IQR) or Q3 + 1.5*IQR and Q1-1.5*IQR (if minimum and maximum values fell outside Q3 + 1.5*IQR and Q1—1.5*IQR; in that case outlying values are denoted by a circle).

