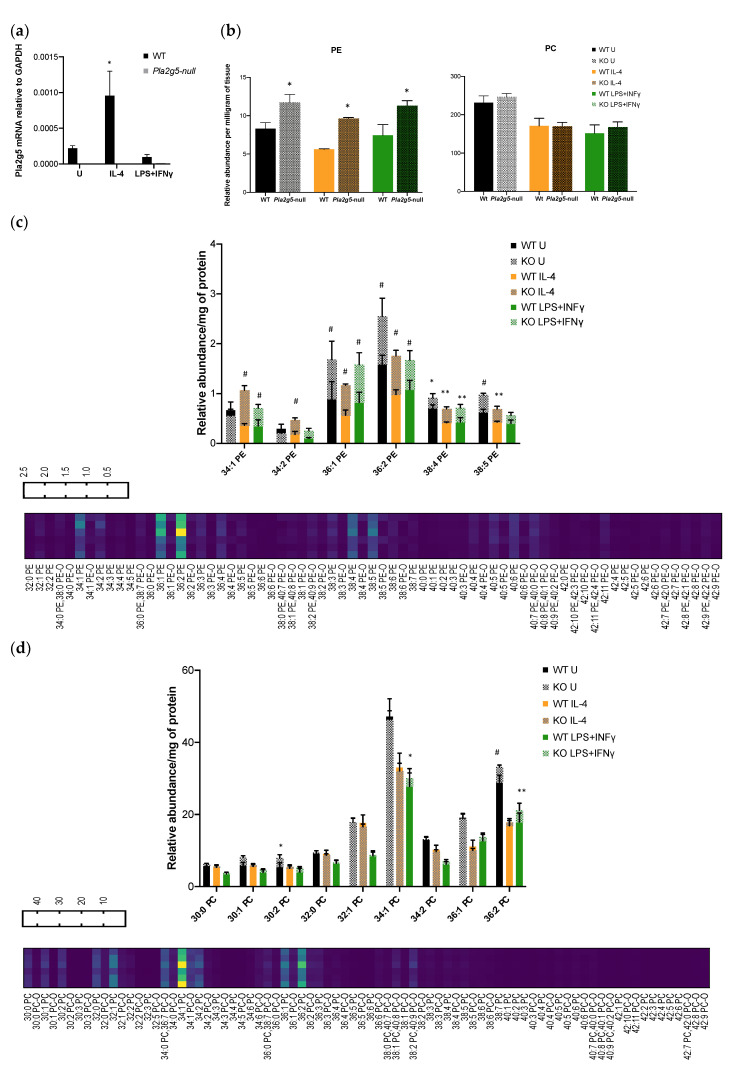
Figure 2.
PE and PC molecules from WT and Group V phospholipase A2 (Pla2g5)-null BM-Macs determined by LC-MS. Expression of Pla2g5 mRNA relative to Glyceraldehyde-3-Phosphate Dehydrogenase (GAPDH) measured by qPCR in WT (black bars) or Pla2g5-null BM-Macs (grey bars), Unstimulated (U) or stimulated with IL-4 or LPS+IFNγ (a). BM-Macs isolated from WT (solid bars) or Pla2g5-null (dotted bars) mice were Unstimulated (U) or treated with IL-4 or LPS+IFNγ for 24 h and (b) total PC and PE, (c) PE, or (d) PC molecules are reported. The data are shown as a heatmap of mean or graph of mean and standard error of three independent determinations. # p < 0.0001, ** p < 0.005, * p < 0.05 by two-way ANOVA with Sidak’s or Tukey’s correction for multiple comparisons.

