Figure 9.
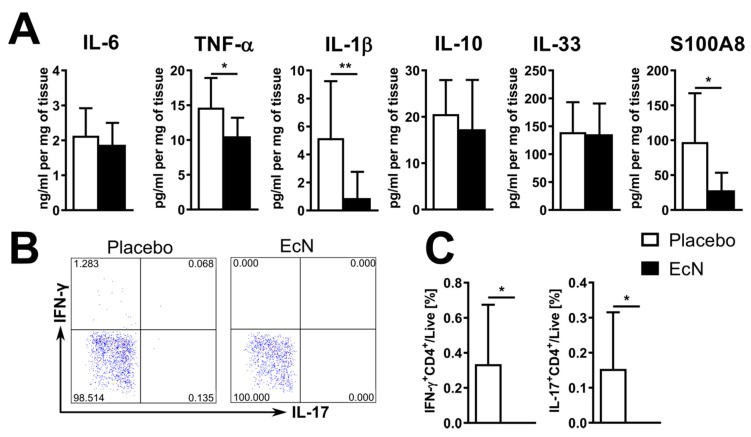
Live oral EcN decreases the production of several pro-inflammatory factors in non-stimulated Peyer’s patches at day 7 post-induction, as measured by ELISA (n = 9 (placebo) or 8 (EcN)) (A). At the same time, live EcN suppressed IFN-γ and IL-17 production by the IRBP-stimulated helper T cells in the inguinal lymph nodes, as shown by the typical dot plot gated on live CD3+CD4+ cells (B) and statistics from 8 (placebo) or 3 (EcN) mice as measured by flow cytometry (C). Differences were quantified by unpaired Mann–Whitney test; * p < 0.05, ** p < 0.01.

